Unable to Clear PDO Watchdog Error Protection

RMP 10.6.7 & INtime v7.1.24270.1

Hi community,

I’ve encountered error 0x65360 on an axis (Panasonic A6B) which cannot be cleared and is unable to resume, enable and operate to run again. As stated on the driver’s manual, it seems to be a PDO Watchdog Error Protection as shown below:

Everything else seems to be operating as usual as the network is still operational. This error seems to occur after prolonged period of operation (running for 20+ days). A network/controller restart, restarting INtime node or power-cycling the driver does not help with clearing the error. Only when power-cycling the PC can help with clearing away the error.

May I know what might be the root cause of this issue?

  • Initially thought it might be the PC affecting the PDO communication from master to the drivers as few axes returned error 0x65360 and few axes returned “No error”
  • And restarting the PC helped to clear away the error which might signify that the RMP/RMP network is starved from resources but I’m not sure if this is the case

PC Specs for reference
Processor: 12th Gen Intel(R) Core™ i7-12700, 2100Mhz, 7 Core(s)
RAM: 16GB
Graphics: Nvidia GTX 1660 Super

Your help is much appreciated. Thank you!

1 Like

Hi @gregory,

An interesting problem. I think we’ll want to collect some of the logs when it in the failing state to get to the root cause. Let me provide some though for now.

I’ve seen something similar to this once before when a different node on the network was taking an unusually long time to transition through its state machine. It wasn’t the faulting node, but a different drive’s delays which caused it once per power cycle of that other faulting drive. We can test this by reducing the network down to just the Panasonic to see what happens.

An issue with startup timing this is not fixed by a NodeA restart, but is fixed by the PC boot cycle makes me wonder if something on the Windows side has bloated to take up resources. You could look for anything out of the ordinary in TaskManager. The state machine should be transitioning within the RTOS. This doesn’t feel like a good explaination.

Steps for Data collection:
Before the issue arises, capture some Windows Task Manager details for later comparison.
Start RMPNetwork.rta on a good start to capture output for comparison with the later bad ones.
Shutdown the network and start normally.

Once the problem occurs, power cycle the Panasonic drive.
Start RMPNetwork.rta and capture the output for study.

If the Panasonic is still in error, power cycle it again.
Reduce the network down to just that 1 node.
Start RMPNetwork.rta and capture the output.

Please let me know if you have any questions.

Hi jacob,

Recently I’ve managed to retrieve the network logs for the error occurred, however, the behaviour now seems to be different where we’re facing intermittent network shutdowns which might occur a few mins after network startup or maybe after a few hours or days.

I’m not sure if the faulting nodes seems to be from the Panasonic drivers or Yaskawa drivers but sometimes it randomly occurs when moving these axes.

Attached is the full network log file starting from when the error is first thrown to its shutdown state:

RMPNetwork: /!\ 10:51:45.245   EtherCAT             EtherCAT.cpp:3135 Last cyclic frame was 1100 us
RMPNetwork: /!\ 10:51:45.877   EtherCAT              EcSlave.cpp:2126 'Drive 0 (Panasonic Minas 6)' (1001): CoE - Emergency (Hex: 0000, 00, '00 00 00 00 00').
RMPNetwork: /!\ 10:51:45.934   EtherCAT              EcSlave.cpp:2126 'Drive 1 (Panasonic Minas 6)' (1002): CoE - Emergency (Hex: 0000, 00, '00 00 00 00 00').
RMPNetwork: /!\ 10:51:45.992   EtherCAT              EcSlave.cpp:2126 'Drive 2 (Panasonic Minas 6)' (1003): CoE - Emergency (Hex: 0000, 00, '00 00 00 00 00').
RMPNetwork: /!\ 10:51:46.060   EtherCAT             EtherCAT.cpp:3135 Last cyclic frame was 1141 us
RMPNetwork: /!\ 10:51:46.374   EtherCAT              EcSlave.cpp:2126 'Drive 13 (Panasonic Minas 6)' (1014): CoE - Emergency (Hex: 0000, 00, '00 00 00 00 00').
RMPNetwork: /!\ 10:51:46.432   EtherCAT              EcSlave.cpp:2126 'Drive 14 (Panasonic Minas 6)' (1015): CoE - Emergency (Hex: 0000, 00, '00 00 00 00 00').
RMPNetwork: /!\ 10:51:46.489   EtherCAT              EcSlave.cpp:2126 'Drive 15 (Panasonic Minas 6)' (1016): CoE - Emergency (Hex: 0000, 00, '00 00 00 00 00').
RMPNetwork: /!\ 10:51:46.579   EtherCAT              EcSlave.cpp:2126 'Drive 17 (Panasonic Minas 6)' (1018): CoE - Emergency (Hex: 0000, 00, '00 00 00 00 00').
RMPNetwork: /!\ 10:51:46.690   EtherCAT             EtherCAT.cpp:3135 Last cyclic frame was 1098 us
RMPNetwork: /!\ 10:51:47.380   EtherCAT             EtherCAT.cpp:3135 Last cyclic frame was 1101 us
RMPNetwork: /!\ 10:51:48.570   EtherCAT             EtherCAT.cpp:3135 Last cyclic frame was 1251 us
RMPNetwork: /!\ 10:51:49.569   EtherCAT             EtherCAT.cpp:3135 Last cyclic frame was 1149 us
RMPNetwork: /!\ 10:51:51.340   EtherCAT             EtherCAT.cpp:3135 Last cyclic frame was 4399 us
RMPNetwork: (i) 10:51:51.378   EtherCAT                YTime.cpp:139  Calculated Clock Adjustment (697) too high, clamping to 345
RMPNetwork: (i) 10:51:51.398   EtherCAT                YTime.cpp:139  Calculated Clock Adjustment (596) too high, clamping to 517
RMPNetwork: /!\ 10:51:51.401   EtherCAT           EcDcMaster.cpp:912  1 working counter failure. WC = 0, expected 1. cmd=Logical Write (LWR)
RMPNetwork: /!\ 10:51:51.401   EtherCAT           EcDcMaster.cpp:912  2 working counter failure. WC = 0, expected 1. cmd=Logical Write (LWR)
RMPNetwork: /!\ 10:51:51.401   EtherCAT           EcDcMaster.cpp:912  3 working counter failure. WC = 0, expected 1. cmd=Logical Write (LWR)
RMPNetwork: (X) 10:51:51.401   EtherCAT           EcDcMaster.cpp:935  Abnormal response of slaves to cyclic commands. Please, check number and state of slaves.
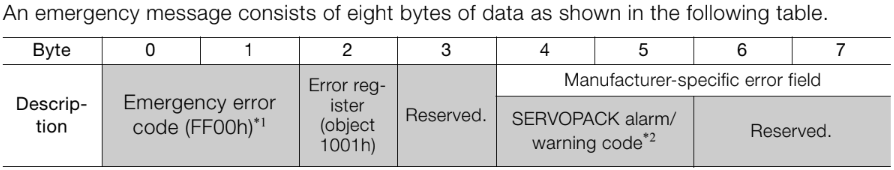
RMPNetwork: /!\ 10:51:51.403   EtherCAT              EcSlave.cpp:2126 'Drive 6 (Yaskawa)' (1007): CoE - Emergency (Hex: ff00, 01, '00 11 0a 00 00').
RMPNetwork: /!\ 10:51:51.403   EtherCAT              EcSlave.cpp:2126 'Drive 11 (Yaskawa)' (1012): CoE - Emergency (Hex: ff00, 01, '00 11 0a 00 00').
RMPNetwork: /!\ 10:51:51.403   EtherCAT              EcSlave.cpp:2126 'Drive 16 (Yaskawa)' (1017): CoE - Emergency (Hex: ff00, 01, '00 11 0a 00 00').
RMPNetwork: (i) 10:51:51.403   EtherCAT              EcSlave.cpp:545  Node Addr (1001) : AL Status (0x8), Code (0x0)
RMPNetwork: (i) 10:51:51.403   EtherCAT              EcSlave.cpp:545  Node Addr (1002) : AL Status (0x8), Code (0x0)
RMPNetwork: (i) 10:51:51.403   EtherCAT              EcSlave.cpp:545  Node Addr (1003) : AL Status (0x8), Code (0x0)
RMPNetwork: (i) 10:51:51.403   EtherCAT              EcSlave.cpp:545  Node Addr (1004) : AL Status (0x8), Code (0x0)
RMPNetwork: (i) 10:51:51.403   EtherCAT              EcSlave.cpp:545  Node Addr (1005) : AL Status (0x8), Code (0x0)
RMPNetwork: (i) 10:51:51.403   EtherCAT              EcSlave.cpp:545  Node Addr (1006) : AL Status (0x8), Code (0x0)
RMPNetwork: (i) 10:51:51.403   EtherCAT              EcSlave.cpp:545  Node Addr (1007) : AL Status (0x8), Code (0x0)
RMPNetwork: (i) 10:51:51.403   EtherCAT              EcSlave.cpp:545  Node Addr (1008) : AL Status (0x8), Code (0x0)
RMPNetwork: (i) 10:51:51.403   EtherCAT              EcSlave.cpp:545  Node Addr (1009) : AL Status (0x8), Code (0x0)
RMPNetwork: (i) 10:51:51.403   EtherCAT              EcSlave.cpp:545  Node Addr (1010) : AL Status (0x8), Code (0x0)
RMPNetwork: (i) 10:51:51.403   EtherCAT              EcSlave.cpp:545  Node Addr (1011) : AL Status (0x8), Code (0x0)
RMPNetwork: (i) 10:51:51.403   EtherCAT              EcSlave.cpp:545  Node Addr (1012) : AL Status (0x8), Code (0x0)
RMPNetwork: (i) 10:51:51.403   EtherCAT              EcSlave.cpp:545  Node Addr (1013) : AL Status (0x8), Code (0x0)
RMPNetwork: (i) 10:51:51.403   EtherCAT              EcSlave.cpp:545  Node Addr (1014) : AL Status (0x8), Code (0x0)
RMPNetwork: (i) 10:51:51.406   EtherCAT              EcSlave.cpp:545  Node Addr (1015) : AL Status (0x8), Code (0x0)
RMPNetwork: (i) 10:51:51.406   EtherCAT              EcSlave.cpp:545  Node Addr (1016) : AL Status (0x8), Code (0x0)
RMPNetwork: (i) 10:51:51.406   EtherCAT              EcSlave.cpp:545  Node Addr (1017) : AL Status (0x8), Code (0x0)
RMPNetwork: (i) 10:51:51.407   EtherCAT              EcSlave.cpp:545  Node Addr (1018) : AL Status (0x8), Code (0x0)
RMPNetwork: (i) 10:51:51.407   EtherCAT              EcSlave.cpp:545  Node Addr (1019) : AL Status (0x8), Code (0x0)
RMPNetwork: (i) 10:51:51.407   EtherCAT              EcSlave.cpp:545  Node Addr (1020) : AL Status (0x8), Code (0x0)
RMPNetwork: (i) 10:51:51.408   EtherCAT              EcSlave.cpp:545  Node Addr (1021) : AL Status (0x8), Code (0x0)
RMPNetwork: (i) 10:51:51.408   EtherCAT              EcSlave.cpp:545  Node Addr (1022) : AL Status (0x8), Code (0x0)
RMPNetwork: (i) 10:51:51.409   EtherCAT              EcSlave.cpp:545  Node Addr (1023) : AL Status (0x8), Code (0x0)
RMPNetwork: (i) 10:51:51.409   EtherCAT              EcSlave.cpp:545  Node Addr (1024) : AL Status (0x8), Code (0x0)
RMPNetwork: (i) 10:51:51.409   EtherCAT              EcSlave.cpp:545  Node Addr (1025) : AL Status (0x8), Code (0x0)
RMPNetwork: (i) 10:51:51.410   EtherCAT              EcSlave.cpp:545  Node Addr (1026) : AL Status (0x8), Code (0x0)
RMPNetwork: (i) 10:51:51.410   EtherCAT              EcSlave.cpp:545  Node Addr (1027) : AL Status (0x8), Code (0x0)
RMPNetwork: (i) 10:51:51.411   EtherCAT              EcSlave.cpp:545  Node Addr (1028) : AL Status (0x8), Code (0x0)
RMPNetwork: (i) 10:51:51.411   EtherCAT              EcSlave.cpp:545  Node Addr (1029) : AL Status (0x8), Code (0x0)
RMPNetwork: (i) 10:51:51.411   EtherCAT              EcSlave.cpp:545  Node Addr (1030) : AL Status (0x8), Code (0x0)
RMPNetwork: (i) 10:51:51.412   EtherCAT              EcSlave.cpp:545  Node Addr (1031) : AL Status (0x8), Code (0x0)
RMPNetwork: /!\ 10:51:51.412   EtherCAT              EcSlave.cpp:2126 'Drive 7 (Yaskawa)' (1008): CoE - Emergency (Hex: ff00, 01, '00 11 0a 00 00').
RMPNetwork: /!\ 10:51:51.413   EtherCAT              EcSlave.cpp:2126 'Drive 12 (Yaskawa)' (1013): CoE - Emergency (Hex: ff00, 01, '00 11 0a 00 00').
RMPNetwork: /!\ 10:51:51.415   EtherCAT              EcSlave.cpp:2126 'Drive 3 (Yaskawa)' (1004): CoE - Emergency (Hex: ff00, 01, '00 11 0a 00 00').
RMPNetwork: /!\ 10:51:51.415   EtherCAT              EcSlave.cpp:2126 'Drive 8 (Yaskawa)' (1009): CoE - Emergency (Hex: ff00, 01, '00 11 0a 00 00').
RMPNetwork: /!\ 10:51:51.415   EtherCAT              EcSlave.cpp:2126 'Drive 18 (Yaskawa)' (1019): CoE - Emergency (Hex: ff00, 01, '00 12 0a 00 00').
RMPNetwork: /!\ 10:51:51.415   EtherCAT              EcSlave.cpp:2126 'Drive 4 (Yaskawa)' (1005): CoE - Emergency (Hex: ff00, 01, '00 11 0a 00 00').
RMPNetwork: /!\ 10:51:51.416   EtherCAT              EcSlave.cpp:2126 'Drive 9 (Yaskawa)' (1010): CoE - Emergency (Hex: ff00, 01, '00 11 0a 00 00').
RMPNetwork: /!\ 10:51:51.416   EtherCAT              EcSlave.cpp:2126 'Drive 19 (Yaskawa)' (1020): CoE - Emergency (Hex: ff00, 01, '00 11 0a 00 00').
RMPNetwork: /!\ 10:51:51.417   EtherCAT              EcSlave.cpp:2126 'Drive 5 (Yaskawa)' (1006): CoE - Emergency (Hex: ff00, 01, '00 11 0a 00 00').
RMPNetwork: /!\ 10:51:51.417   EtherCAT              EcSlave.cpp:2126 'Drive 10 (Yaskawa)' (1011): CoE - Emergency (Hex: ff00, 01, '00 11 0a 00 00').
RMPNetwork: /!\ 10:51:51.432   EtherCAT             EtherCAT.cpp:769  State changed from Running to StoppingOnError
RMPNetwork: (X) 10:51:51.433   EtherCAT    RMPNetworkStarter.cpp:150  Ready to Shutdown
RMPNetwork: (i) 10:51:51.433   EtherCAT    RMPNetworkStarter.cpp:184  Main Network Loop finished
RMPNetwork: (X) 10:51:51.558   EtherCAT   RMPNetworkFirmware.cpp:1804 Failed to get Service Channel semaphore
RMPNetwork: (i) 10:51:51.558   EtherCAT   RMPNetworkFirmware.cpp:1484 Exiting ServiceChannel Thread
RMPNetwork: /!\ 10:51:52.995   EtherCAT             EtherCAT.cpp:769  State changed from StoppingOnError to Error
RMPNetwork: /!\ 10:51:55.183   EtherCAT             EtherCAT.cpp:3978 --> Close driver

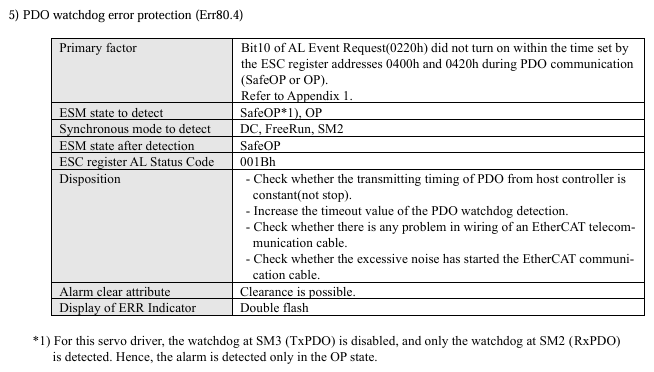
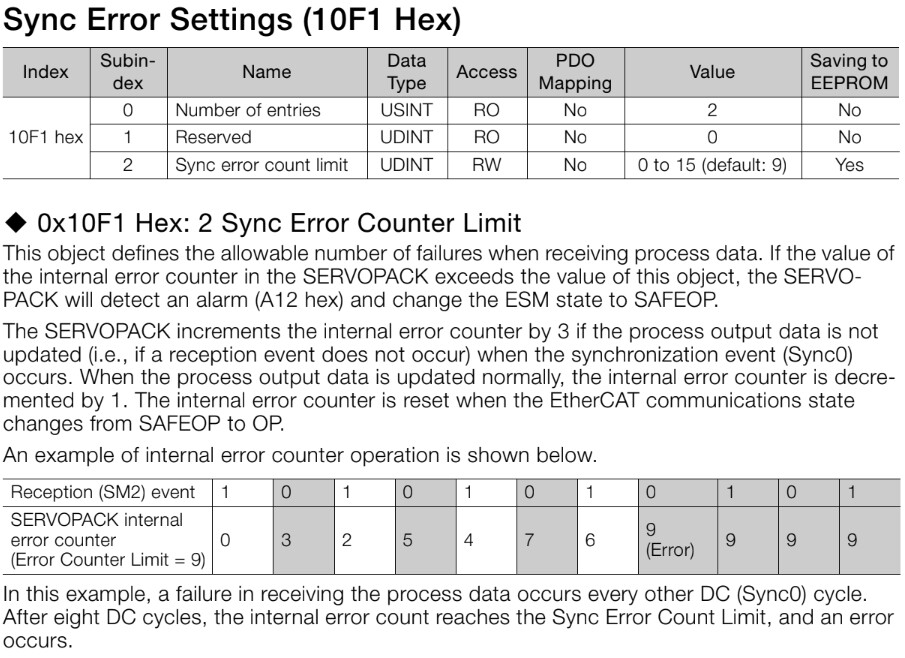
May I know what might be the root cause for this and what does the CoE - Emergency (Hex) codes return as the driver side just returns a general “EtherCAT communication was not in Operational state” alarm/error

or

What are some things that we could try on to mitigate this issue or prevent it from occuring?

Your help is very much appreciated. Thank you!

1 Like

Hi @gregory,

I think you are experience some type of jitter on the system. The log shows normal operation until something happens around timestamp (10:51:51.340) Which indicates a 4399us cycle. That would be missing over 3 samples of exchanged data. It doesn’t surprise me at all you would Working Counter errors. I’m a bit surprised that the nodes all stayed Operational (AL Status = 0x8) but you were hitting a cascade of errors which ultimately shut the network down.

Take a look at our PC hardware and performance page for evaluating the system in question:

Hopefully it can guide you to the next step. Please let me know if you have questions about it.

1 Like

Hi jacob,

Thank you for the clarification and recommendation for the hardware settings. We’ve tried following the BIOS Optimization settings as recommended but it seems like the intermittent network disconnection error still persists.

Note:- This seems to occur on several machines with one common factor being the network topology (same drivers - all have Sigma7 750W). Another machine encountered this issue once upgraded from Windows 10 to 11 (previously Windows 10 did not encounter this issue). Another machine that has only one of this driver doesn’t seem to have this error occurring.

The situation currently seems to be as follows:
1st Machine

  • Windows 10, Multiple Sigma7 750W drivers - network disconnection occurs

2nd Machine

  • Windows 10, one Sigma7 750W driver - network disconnection does not occur

3rd Machine

  • Windows 10, one Sigma7 750W driver - network disconnection does not occur
  • Upgraded to Windows 11, one Sigma7 750W driver - network disconnection occurs (This one might be due to Windows upgrade causing a reset to kernel settings reverting it to default, erasing INtime’s kernel settings so we will try to reinstall INtime to see if it still persists)

Can a faulting node (driver) be the root cause as this seems to be the only common factor between the machines (they all have different hardware configurations and axis count)

Could this be a possible reason the network disconnection issue is occuring? (Yaskawa soft reboot via SDO causing network shutdown)

Also may I know what are some other possible root causes that might cause this intermittent network disconnection issue from occuring or what are some other tests we may conduct? (we will try isolating the suspected faulting node itself first)

Much appreciated on the feedback. Many thanks!

1 Like

Hi jacob,

A slight update on the disconnection behaviour, our observation for the machines is as follows:

Conduct motion normally (Eg. Usual startup, straight into motion etc.)

  • No network dc error occur (network is fine :white_check_mark:)

Let EtherCAT network idle for about 1 hour then conduct motion

  • The EtherCAT network shuts down halfway through the motion (network dies :cross_mark:)

It seems like when the EtherCAT network is idle for an extended period of time, any activity afterwards like running motion will result in EtherCAT cyclic time spiking and disconnect the network

*Note:- A vision system is running as well so could it be when the IPC is idle/inactive for awhile (enters sort of a rest state) then suddenly it is forced to run both vision and motion at the same time (no warmup/prior warning then is expected to run at full speed)

Could this possibly due to a timing / synchronization degradation issue that accumulates over time when the EtherCAT network is idle then it is forced to be active again after awhile?

When the network dc error occurs, the EtherCAT cyclic time will spike up to 3-4ms from the expected 1ms and prompt this CoE - Emergency Hex code from the Yaskawa drive:

RMPNetwork: /!\ 41:47:11.150   EtherCAT             EtherCAT.cpp:3135 Last cyclic frame was 1099 us
RMPNetwork: /!\ 41:47:11.802   EtherCAT             EtherCAT.cpp:3135 Last cyclic frame was 1101 us
RMPNetwork: /!\ 41:47:12.592   EtherCAT             EtherCAT.cpp:3135 Last cyclic frame was 1100 us
RMPNetwork: /!\ 41:47:17.703   EtherCAT             EtherCAT.cpp:3135 Last cyclic frame was 1099 us
RMPNetwork: /!\ 41:47:18.337   EtherCAT             EtherCAT.cpp:3135 Last cyclic frame was 3653us
RMPNetwork: (i) 41:47:18.362   EtherCAT                YTime.cpp:139  Calculated Clock Adjustment (539) too high, clamping to 397
RMPNetwork: /!\ 41:47:18.393   EtherCAT           EcDcMaster.cpp:912  1 working counter failure. WC = 0, expected 1. cmd=Logical Write (LWR)
RMPNetwork: /!\ 41:47:18.394   EtherCAT           EcDcMaster.cpp:912  2 working counter failure. WC = 0, expected 1. cmd=Logical Write (LWR)
RMPNetwork: (i) 41:47:18.394   EtherCAT           EcSlave.cpp:545  Node Addr (1001) : AL Status (0x8), Code (0x0))
RMPNetwork: (i) 41:47:18.394   EtherCAT           EcSlave.cpp:545  Node Addr (1002) : AL Status (0x8), Code (0x0))
RMPNetwork: (i) 41:47:18.394   EtherCAT           EcSlave.cpp:545  Node Addr (1003) : AL Status (0x8), Code (0x0))
RMPNetwork: (i) 41:47:18.394   EtherCAT           EcSlave.cpp:545  Node Addr (1004) : AL Status (0x8), Code (0x0))
RMPNetwork: /!\ 41:47:18.395   EtherCAT           EcDcMaster.cpp:912  3 working counter failure. WC = 0, expected 1. cmd=Logical Write (LWR)
RMPNetwork: (X) 41:47:18.395   EtherCAT           EcDcMaster.cpp:935  Abnormal response of slaves to cyclic commands. Please, check number and state of slaves.
RMPNetwork: /!\ 41:47:18.396   EtherCAT              EcSlave.cpp:2126 'Drive 2 (Yaskawa)' (1003): CoE - Emergency (Hex: ff00, 01, '00 11 0a 00 00').
RMPNetwork: /!\ 41:47:18.679   EtherCAT             EtherCAT.cpp:769  State changed from Running to StoppingOnError
RMPNetwork: (X) 41:47:18.679   EtherCAT    RMPNetworkStarter.cpp:150  Ready to Shutdown
RMPNetwork: (i) 41:47:18.679   EtherCAT    RMPNetworkStarter.cpp:184  Main Network Loop finished
RMPNetwork: (X) 41:47:18.804   EtherCAT   RMPNetworkFirmware.cpp:1804 Failed to get Service Channel semaphore
RMPNetwork: (i) 41:47:18.804   EtherCAT   RMPNetworkFirmware.cpp:1484 Exiting ServiceChannel Thread
RMPNetwork: /!\ 41:47:18.963   EtherCAT             EtherCAT.cpp:3135 Last cyclic frame was 779us
RMPNetwork: /!\ 41:47:20.242   EtherCAT             EtherCAT.cpp:769  State changed from StoppingOnError to Error
RMPNetwork: /!\ 41:47:22.429   EtherCAT             EtherCAT.cpp:3978 --> Close driver

May I know what does Drive 2 (Yaskawa)’ (1003): CoE - Emergency (Hex: ff00, 01, ‘00 11 0a 00 00’) indicates?

  • As it seems only Yaskawa drives return this error (maybe due to Yaskawa drives being more stricter) once the EtherCAT cycle time spikes and network shuts down, could it be a manufacturer specific error citing driver could no longer communicate with the master?

Your help and feedback is much appreciated. Thank you!

1 Like

Hi @gregory,

I’d like at system configuration, process allocation, and maybe system tuning.

The MotionController and the Network are never idle. Every sample the firmware is processing all of its internals and producing a new target to send out every sample. Its fully active and processing. We don’t spin up threads when Motion starts. The only difference I can think of would be if motion creates errors, we will fetch more detail via the Service Channel in response to those errors.

I assume the vision system and your program is also idle during the hour of “inactivity.” If you take a snapshot of the associated processes when initially going idle and then just before motion do you see any differences? Do you kick off any new system processes/stress when starting motion?


For system configuration, I’d recheck that you have all hibernation/efficiency/sleep settings disabled and are set to best performance.

I’d also run the plateval tool from the INtime Bin folder to make sure I don’t have any red settings.


I believe the error you are seeing is
image
Here is a Yaskawa section on decoding CoE emergency messages:

This is likely responding to the 3-4ms spike you are seeing. Yaskawa Drives are going to hit a Sync Error Limit which will shut down the network. You can configure the drives for more tolerance or even disable it, but I’d recommend you work on system tuning to ensure you lose multiple samples. Here some detail on the Sync error settings.

2 Likes