I am seeing intermittent network crashes, sometimes with the following logs and sometimes with no logs at all. Crashes happen anywhere from after ~2 hours of runtime to as little as 2 minutes.
Background:
We are running on a Nvidia Jetson Orin NX 8GB with a carrier board from Forecr
RMP is running in a docker container with a C++ wrapper application handling network initialization and controller configuration
We have two other docker containers that use the Rapidcode SDK to access the controller. One is our state machine written in C++ and the other is a manual motor control gui written in Python. Only one should be active at any given time.
*The entire set of logs exceeds this post’s character limit so I deleted some repetive messages
2025-06-18 07:47:39.010 (3886.873s) [main thread     ]         psdn_namazu.cc:77     ERR| EtherCAT network is not operational, exiting
2025-06-18 07:47:39.010 (3886.873s) [main thread     ]         psdn_namazu.cc:83     ERR| Network log message: /!\ 00:47:46.180   EtherCAT             EtherCAT.cpp:3137 Last cyclic frame was 1079 us
2025-06-18 07:47:39.011 (3886.875s) [main thread     ]         psdn_namazu.cc:83     ERR| Network log message: /!\ 00:55:36.749        IDE             EcMaster.cpp:1047 EtherCAT missed                                                       3626602752 receive frame during the last 2000 cycles (EtherCAT missed
2025-06-18 07:47:39.011 (3886.875s) [main thread     ]         psdn_namazu.cc:83     ERR| Network log message: /!\ 00:55:38.206   EtherCAT             EtherCAT.cpp:3137 Last cyclic frame was 1077 us
2025-06-18 07:47:39.012 (3886.876s) [main thread     ]         psdn_namazu.cc:83     ERR| Network log message: /!\ 00:58:52.507   EtherCAT             EtherCAT.cpp:3137 Last cyclic frame was 1095 us
2025-06-18 07:47:39.013 (3886.876s) [main thread     ]         psdn_namazu.cc:83     ERR| Network log message: /!\ 00:58:54.744        IDE             EcMaster.cpp:1047 EtherCAT missed                                                       3626602752 receive frame during the last 2000 cycles (EtherCAT missed
2025-06-18 07:47:39.013 (3886.876s) [main thread     ]         psdn_namazu.cc:83     ERR| Network log message: /!\ 00:58:56.744        IDE             EcMaster.cpp:1047 EtherCAT missed                                                       3626602752 receive frame during the last 2000 cycles (EtherCAT missed
2025-06-18 07:47:39.013 (3886.876s) [main thread     ]         psdn_namazu.cc:83     ERR| Network log message: /!\ 00:58:58.744        IDE             EcMaster.cpp:1047 EtherCAT missed                                                       3626602752 receive frame during the last 2000 cycles (EtherCAT missed
2025-06-18 07:47:39.013 (3886.876s) [main thread     ]         psdn_namazu.cc:83     ERR| Network log message: /!\ 00:59:00.726   EtherCAT             EtherCAT.cpp:3137 Last cyclic frame was 1100 us
2025-06-18 07:47:39.014 (3886.877s) [main thread     ]         psdn_namazu.cc:83     ERR| Network log message: /!\ 01:04:38.539   EtherCAT             EtherCAT.cpp:3137 Last cyclic frame was 1097 us
2025-06-18 07:47:39.014 (3886.877s) [main thread     ]         psdn_namazu.cc:83     ERR| Network log message: /!\ 01:04:38.737        IDE             EcMaster.cpp:1047 EtherCAT missed                                                       3626602752 receive frame during the last 2000 cycles (EtherCAT missed
2025-06-18 07:47:39.014 (3886.877s) [main thread     ]         psdn_namazu.cc:83     ERR| Network log message: (X) 01:04:38.737   EtherCAT    RMPNetworkStarter.cpp:168  RMP is dead
2025-06-18 07:47:39.014 (3886.877s) [main thread     ]         psdn_namazu.cc:83     ERR| Network log message: (X) 01:04:38.839   EtherCAT RMPNetworkFirmwareLinux.cpp:68   Failed to wait on a semaphore (with a timeout of 100 milliseconds).  |  errno: [110] "Connection timed out"
2025-06-18 07:47:39.014 (3886.877s) [main thread     ]         psdn_namazu.cc:83     ERR| Network log message: (i) 01:04:38.839   EtherCAT   RMPNetworkFirmware.cpp:1833 Exiting ServiceChannel Thread
2025-06-18 07:47:39.014 (3886.877s) [main thread     ]         psdn_namazu.cc:83     ERR| Network log message: /!\ 01:04:39.662   EtherCAT             EtherCAT.cpp:3137 Last cyclic frame was 927 us
2025-06-18 07:47:39.014 (3886.877s) [main thread     ]         psdn_namazu.cc:83     ERR| Network log message: /!\ 01:04:39.828   EtherCAT              EcSlave.cpp:2138 'Drive 0 (Kollmorgen AKD2G SIL2)' (1001): CoE - Emergency (Hex: 0000, 00, '00 00 00 00 00').
2025-06-18 07:47:39.014 (3886.877s) [main thread     ]         psdn_namazu.cc:83     ERR| Network log message: /!\ 01:04:39.828   EtherCAT              EcSlave.cpp:2138 'Drive 1 (Kollmorgen AKD2G SIL2)' (1002): CoE - Emergency (Hex: 0000, 00, '00 00 00 00 00').
2025-06-18 07:47:39.014 (3886.877s) [main thread     ]         psdn_namazu.cc:83     ERR| Network log message: /!\ 01:04:39.832   EtherCAT              EcSlave.cpp:2138 'Drive 0 (Kollmorgen AKD2G SIL2)' (1001): CoE - Emergency (Hex: 0000, 00, '00 00 00 00 00').
2025-06-18 07:47:39.014 (3886.877s) [main thread     ]         psdn_namazu.cc:83     ERR| Network log message: (X) 01:04:39.977   EtherCAT             EtherCAT.cpp:704  EtherCAT communication broken during system operation
2025-06-18 07:47:39.014 (3886.877s) [main thread     ]         psdn_namazu.cc:83     ERR| Network log message: /!\ 01:04:39.977   EtherCAT             EtherCAT.cpp:769  State changed from Running to StoppingOnError
2025-06-18 07:47:39.014 (3886.877s) [main thread     ]         psdn_namazu.cc:83     ERR| Network log message: (X) 01:04:40.834   EtherCAT          LinuxDevice.cpp:178  No frames received after 1000 milliseconds! Stopping reception of packets.
2025-06-18 07:47:39.014 (3886.877s) [main thread     ]         psdn_namazu.cc:83     ERR| Network log message: /!\ 01:04:41.301   EtherCAT             EtherCAT.cpp:769  State changed from StoppingOnError to Error
2025-06-18 07:47:39.014 (3886.877s) [main thread     ]         psdn_namazu.cc:83     ERR| Network log message: (X) 01:04:43.361   EtherCAT             EtherCAT.cpp:1204 Timeout waiting for motion engines to stop
2025-06-18 07:47:39.014 (3886.877s) [main thread     ]         psdn_namazu.cc:83     ERR| Network log message: /!\ 01:04:44.361   EtherCAT             EtherCAT.cpp:3980 --> Close driver
2025-06-18 08:37:07.460 (  15.685s) [main thread     ]         psdn_namazu.cc:65    INFO| Namazu is now healthy
2025-06-18 09:46:40.626 (4188.851s) [main thread     ]         psdn_namazu.cc:77     ERR| EtherCAT network is not operational, exiting
2025-06-18 09:46:40.626 (4188.851s) [main thread     ]         psdn_namazu.cc:27    INFO| Updated health status file: NOT_READY
2025-06-18 09:46:40.626 (4188.851s) [main thread     ]         psdn_namazu.cc:95    INFO| Shutting down
2025-06-18 09:46:40.626 (4188.851s) [main thread     ]   RapidCodeWrapper.cpp:178   INFO| Shutting down the network..
// Check network health
        if (!wrapper->IsNetworkOperational()) {
            LOG_F(ERROR, "EtherCAT network is not operational, exiting");

            int messagesToRead = wrapper->GetController()->NetworkLogMessageCountGet();                  // Some kind of error starting the network, read the network log messages

            for (int i = 0; i < messagesToRead; i++)
            {
                LOG_F(ERROR, "Network log message: %s", wrapper->GetController()->NetworkLogMessageGet(i));                      // Print all the messages to help figure out the problem
            }

            break;
        }
I can see from the network log that something has gone wrong. There are quite a few “EtherCAT missed” messages. Then an RMP is dead message.
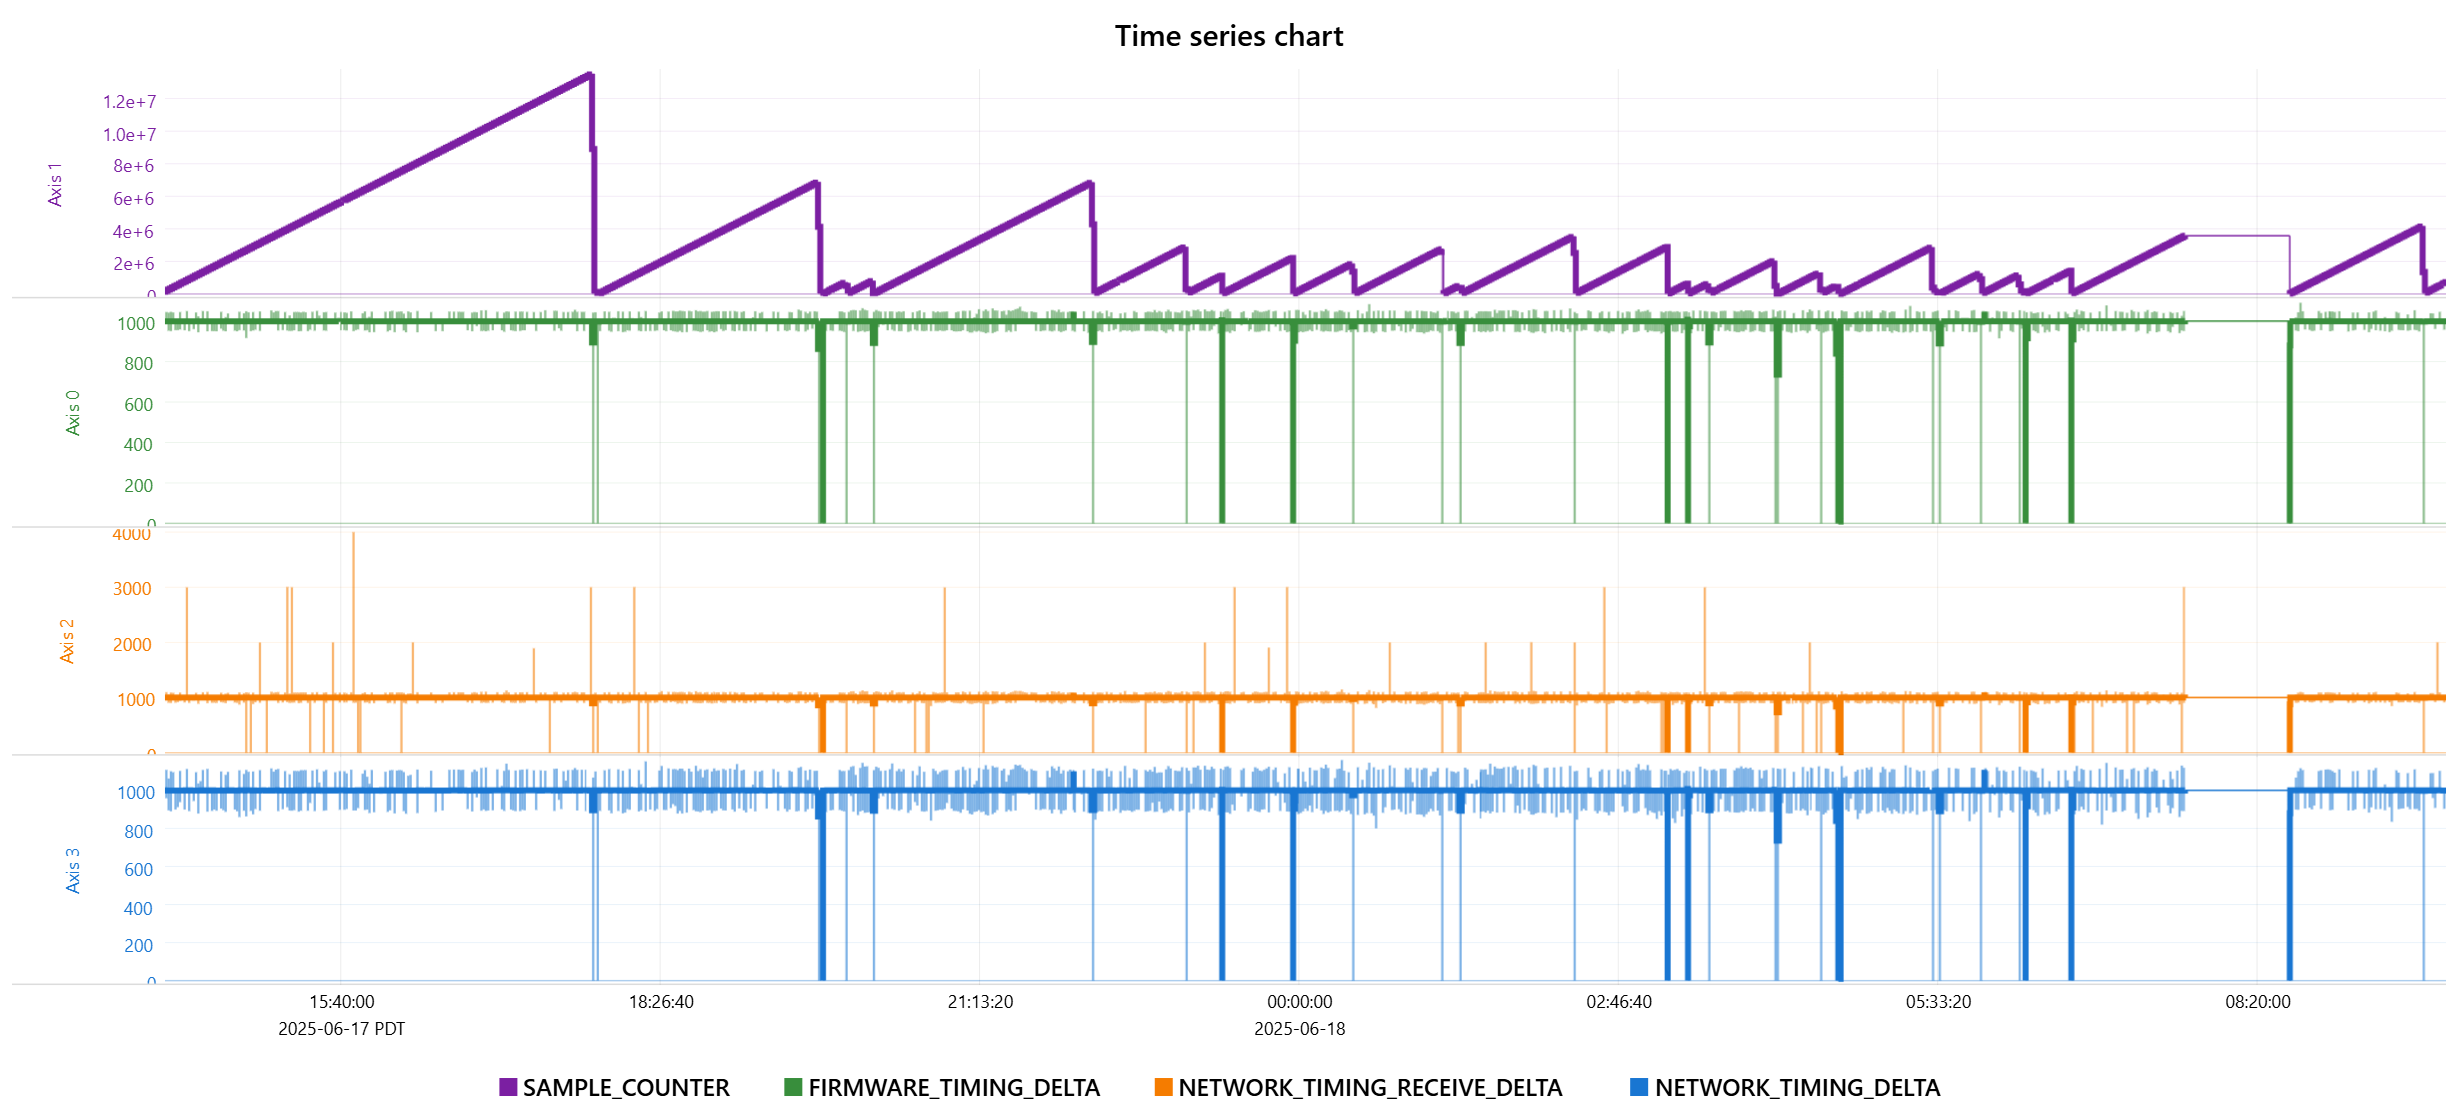
In some of your first image that you are losing the RMP quite a few times where the sample counter returns to 0. Do you have some auto recovery code that is restarting the RMP which we are sure isn’t being called unintentionally?
Can you tell me what has changed recently -or- is this a new setup you are testing?
Does this have the RT kernel setup with the Core RMP is running on isolated?
How do the cyclictest results look like for this setup?
We are using docker compose to orchestrate our containers. I throw a runtime error when the network is not operational, so the container exits. Docker compose then handles restarting the container automatically. So to answer your question, the container will only restart if it crashes by itself first. And the logs we are seeing confirm it is crashing because the network is not operational.
We are running Ubuntu Linux with the PreempRT patch. Here is our RMP docker compose service definition
I am planning on doing some testing to isolate the issue. I do not think this happens with RMP and our wrapper app running by itself. So I am suspecting that one of our other services is somehow interfering. The most recent addition was the motor control gui. but we also have a couple other container running including:
RMP
State Machine
Motor Control GUI
Machine Vision / Perception
Telegraf
Also probably worth mentioning, We have the EtherCAT nodes connected on eth0, we have a camera connected on eth1, and we are connected to the internet on eth2. Eth0 and eth1 are onboard rj45 ports and eth2 is an usb ethernet adapter.
Your results are similar to what we might expect to see if/when RMP is run on a system with poor real-time performance. Which CPU core are you isolating for RMP? Can you confirm that no other processes (besides rmp and rmpnetwork) are running on that core?
Using cyclictest can sometimes help confirm if your real-time performance degrades under load, so it might give you some additional clues.
Is this the first time you’ve run all our services together or is this a newly installed system?
Do you want me to run cyclictest with everything running? including rmp and rmpnetwork?
I noticed this issue after using all of our services together. previously we were testing with just our wrapper app, or with the wrapper+state machine. I am able to now confirm removing the control gui did not resolve the issue. going to continue isolating our services today.
Do you think decreasing network sample rate from 1000hz to 500hz or 250hz would make a difference?
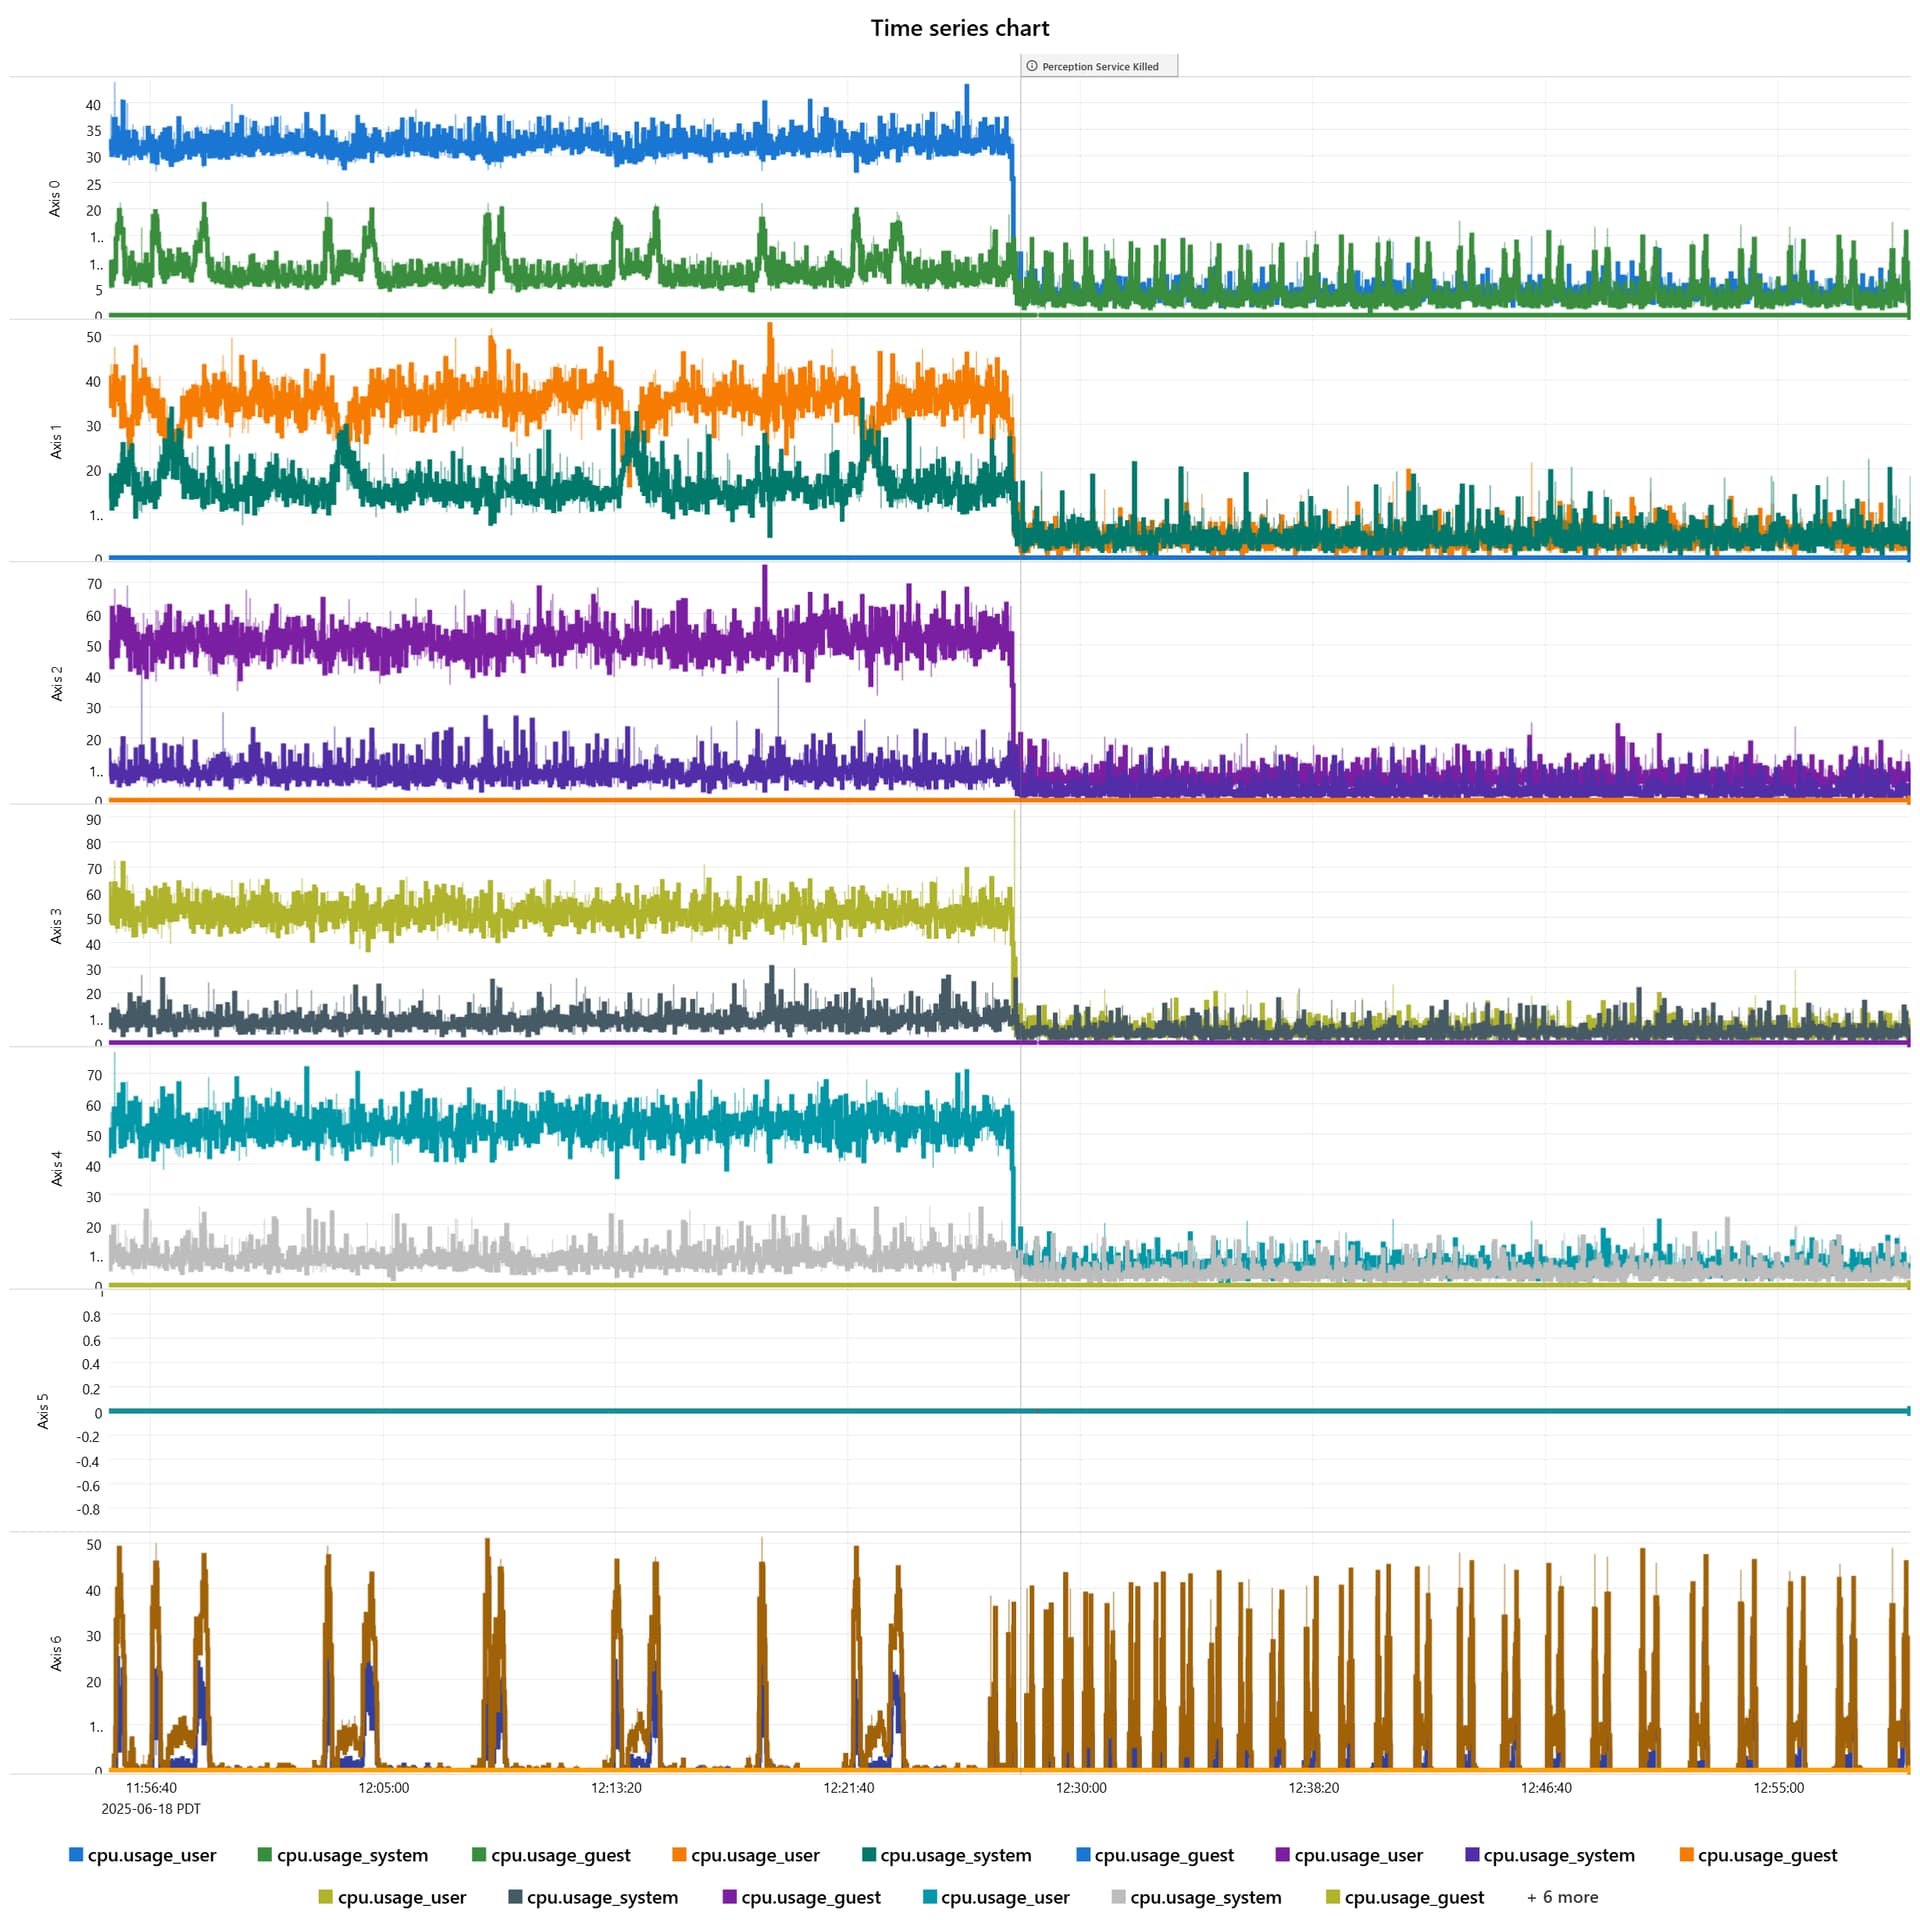
I can confirm that killing our control gui and state machine did not resolve the issue. BUT killing our perception service has resolved the issue so far. I can see a distinct difference in jitter on all metrics.
I think the best test will be to run cyclictest on core 5 while the perception service is running (without rmp or rmpnetwork). I would expect to see its max latency spike in that case. Lowering the RMP sample could help, but it’s probably worth investigating the issue a little deeper to see if we can get better real-time behavior on core 5.
What kernel parameters did you use when isolating core 5 (e.g. isolcpus=5, nohz_full=5, rcu_nocbs=5)?
Scott’s right for sure that you should start with cyclictest on that core and just start running down the numbers of interrupts processed on the isolated cpu, irq affniities, etc, when perception is running or not.
One thing to keep in mind - core isolation on it’s own (without other flags that scott is mentioning, etc) generally only ensures that user space threads don’t go into the core. It will not necessarily stop all kernel threads from running on them, will not stop various kernel interrupts from happening on them, etc. Managed irqs will also happen on them (SMI/etc), which can cause huge spikes.
At a minimum, you probably want isolcpus=managed_irq,5 nohz_full=5 rcu_nocbs=5. It looks from the command line you only have isolcpus.
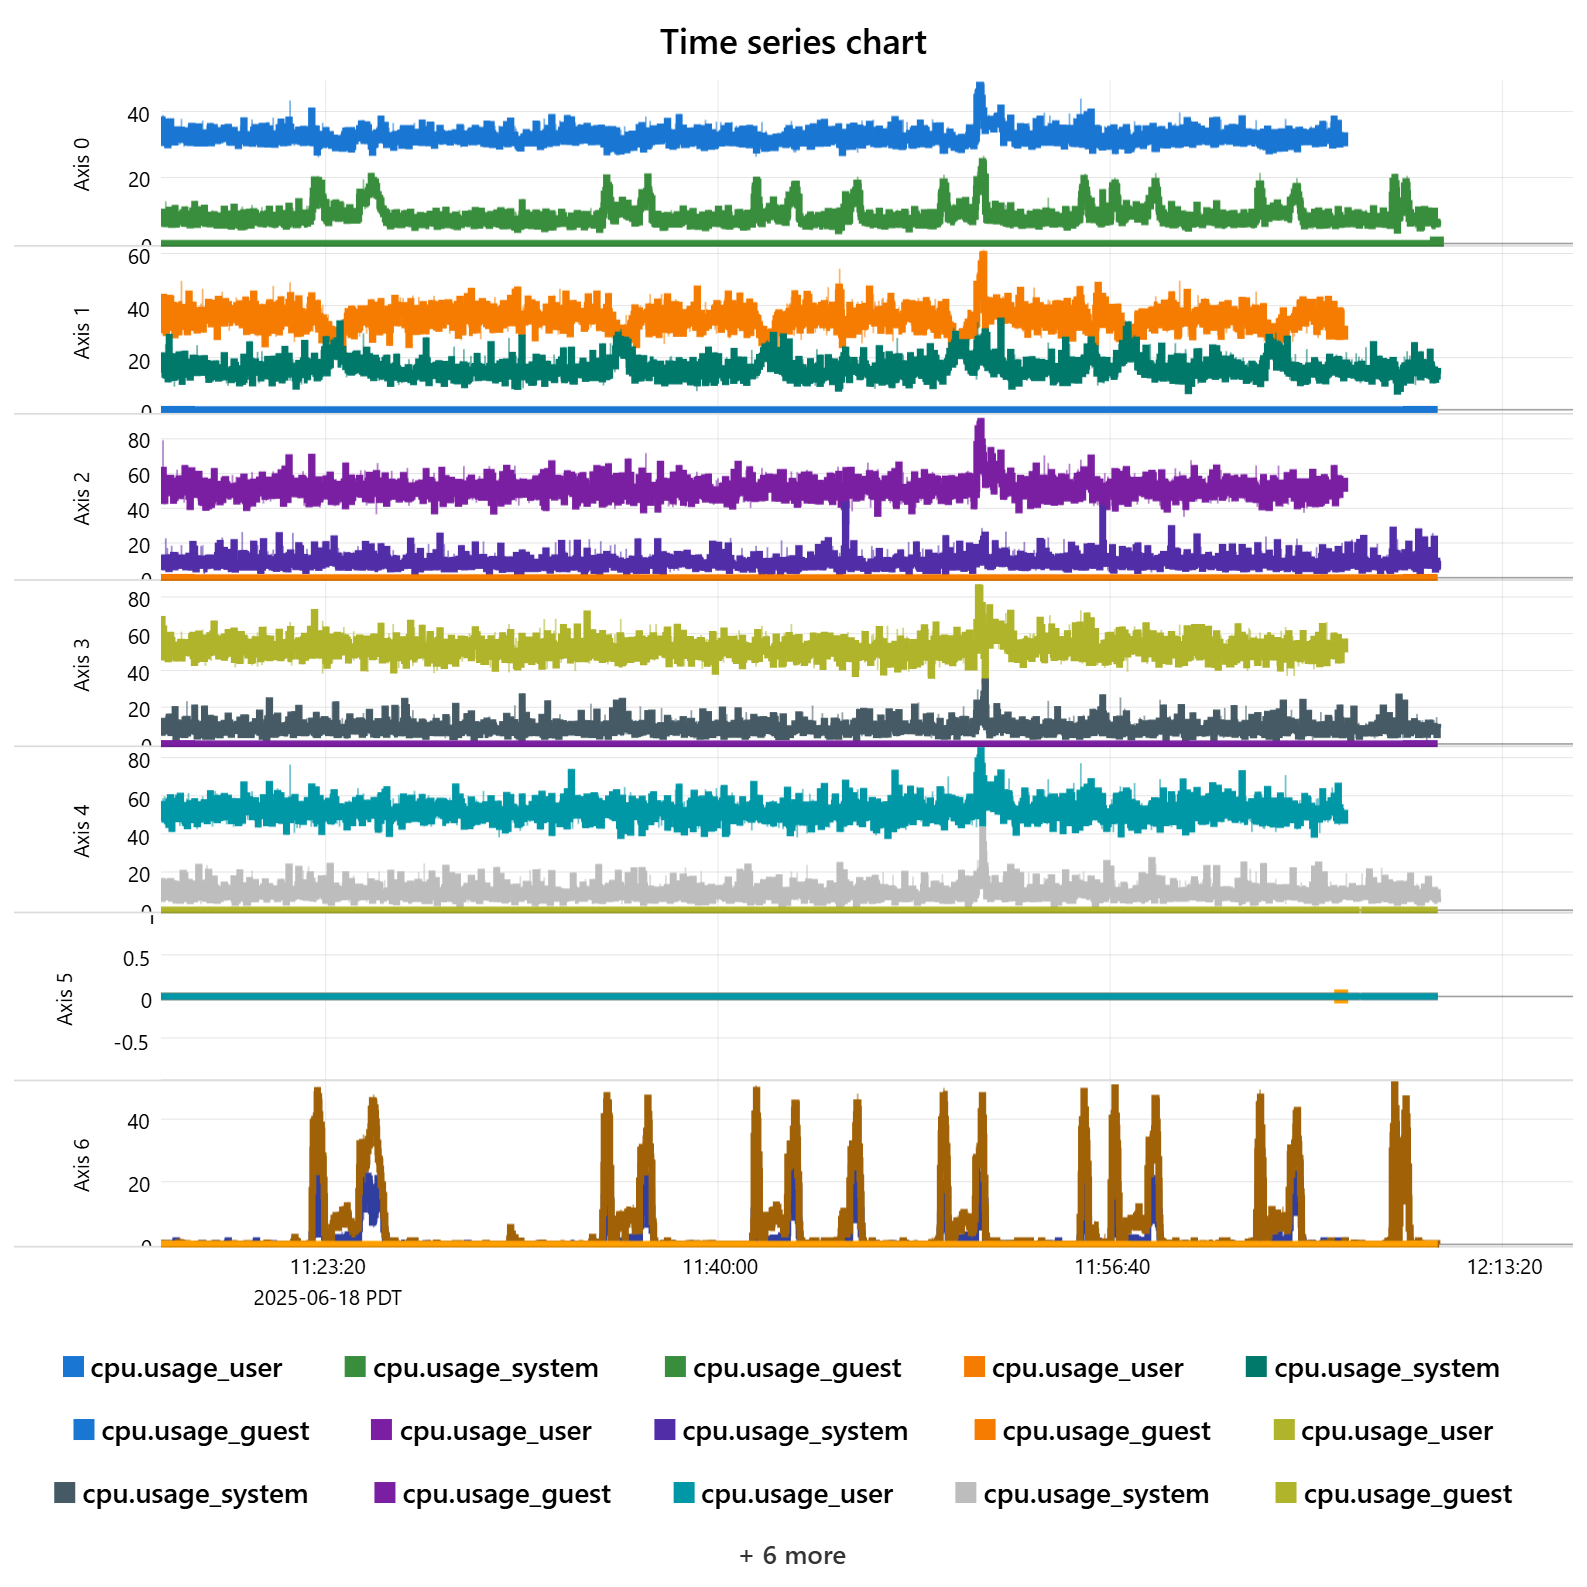
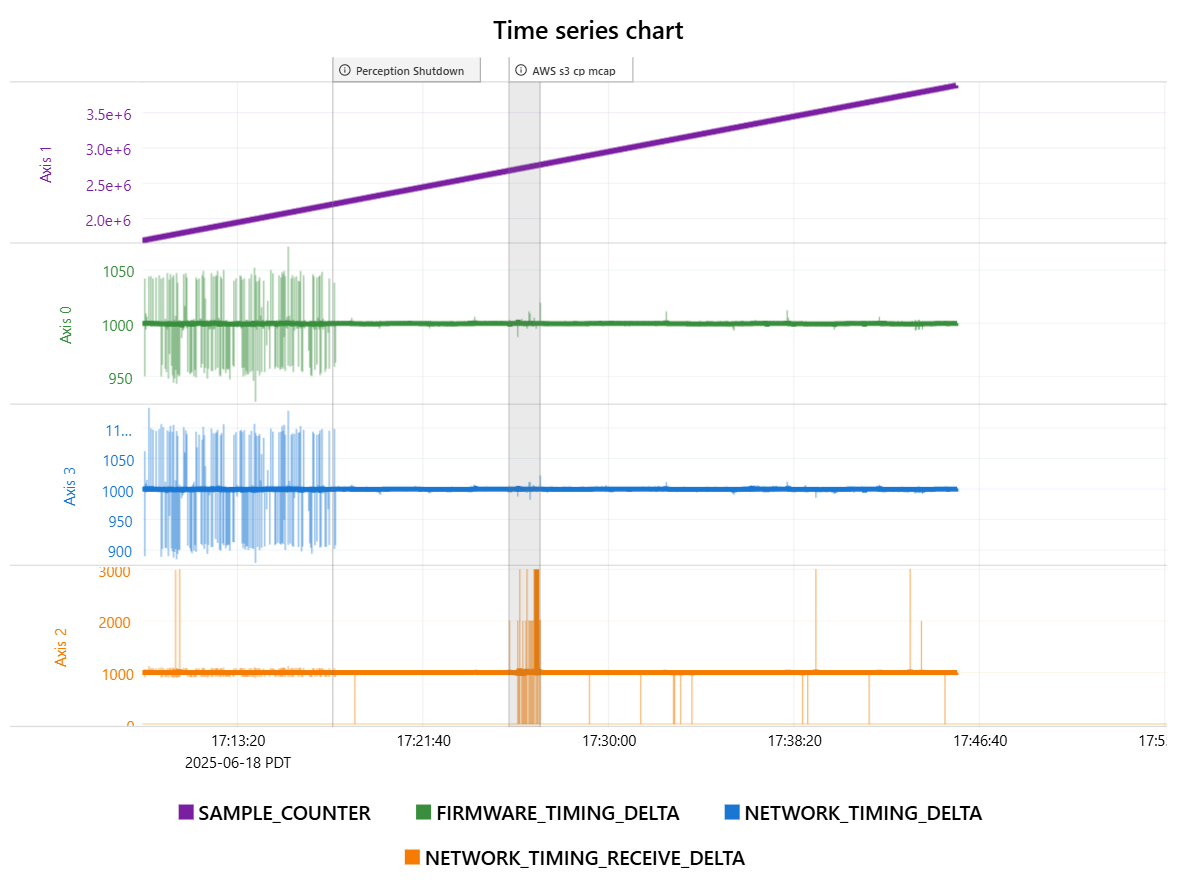
So we made the changes specified but we still seem to be seeing some restarts. We can see the same jitter on firmware + network timing delta that goes away when we shutdown perception. Interesting additional finding is that when we download a large file over the network (over a USB-ethernet adapter interface) we see a large increase in jitter in network_timing_receive but no jitter in firmware or network timing deltas.
Agreed, your jitter during perception is reasonable, except for on the network receive timing.
The USB-Ethernet file copy is a good clue. We suspect it could be related to a barrage of interrupts that are interfering with eth0. This is rare, though we did see some similar issues on an older x64 system and had a special script for dealing with it. See /rsi/tune_my_nic.sh for an example of tweaking IRQs and their CPU affinities. The idea is that you want only allow eth0 IRQs on core 5, and all other interrupts to use cores 0-4.
Try cat /proc/interrupts to see which CPU cores are handling interrupts.
So yesterday we gave that a try and discovered that network and io interrupts for our jetson orin with our current kernel seem to all be pinned to core 0 with no way to adjust the affinity. ctx
Over night we ran a similar reliability test where we isolated perception from core 0 and got noticeably improved performance.
That’s a nice improvement, but it still looks like poor NIC performance. Can you try using the other gigabit NIC to see if it’s more isolated from the USB NIC? We also had a customer successfully run (a demo, not production) a USB NIC for EtherCAT (we were surprised).
If you’re not shutting the network down or disconnecting nodes, we’d expect it to run for weeks and months. We are working on improved diagnostics. For now, you’re limited to MotionController methods, LastNetworkStartErrorGet(), NetworkLogMessageCountGet() and NetworkLogMessageGet().
We might need to try some other solution here to isolate or improve performance. We are still seeing network crashes - particularly during startup. We have noticed a few odd behaviors with the motion controller.
We have observed that when we Attach to a motion controller in a separate container, NetworkState() sometimes remains as operational despite the network crashing.
We have observed a failure mode where the network doesn’t seem to realize it’s crashed and the only symptom that indicates its crashed (recorders are still running but motors are not reporting) is that network jitter seems to freeze. (I’ll dig for more symptoms here)
The primary thing is how can we reliably restart operation if the network does crash.
NetworkStateGet() is ultimately just reading a value from shared memory that should be updated (if the Network thread isn’t hung). One thing you can do is check the NetworkCounterGet() to see if it is incrementing over a short time period.
I haven’t seen a case where jitter induced error hangs the network thread before.
Please let me know if there is anything I can do to help.
Thanks @jacob
To refresh: we have two processes. Namazu starts the controller and the SM attaches to the controller. Namazu collects the data from recorders and publishes it.
Both Namazu and SM use the IsNetworkOperational() function to determine if the network is running. Namazu will crash when the network seems to crash. SM does not.
I’ll add that check in the SM which verifies that the sample counter is incrementing.
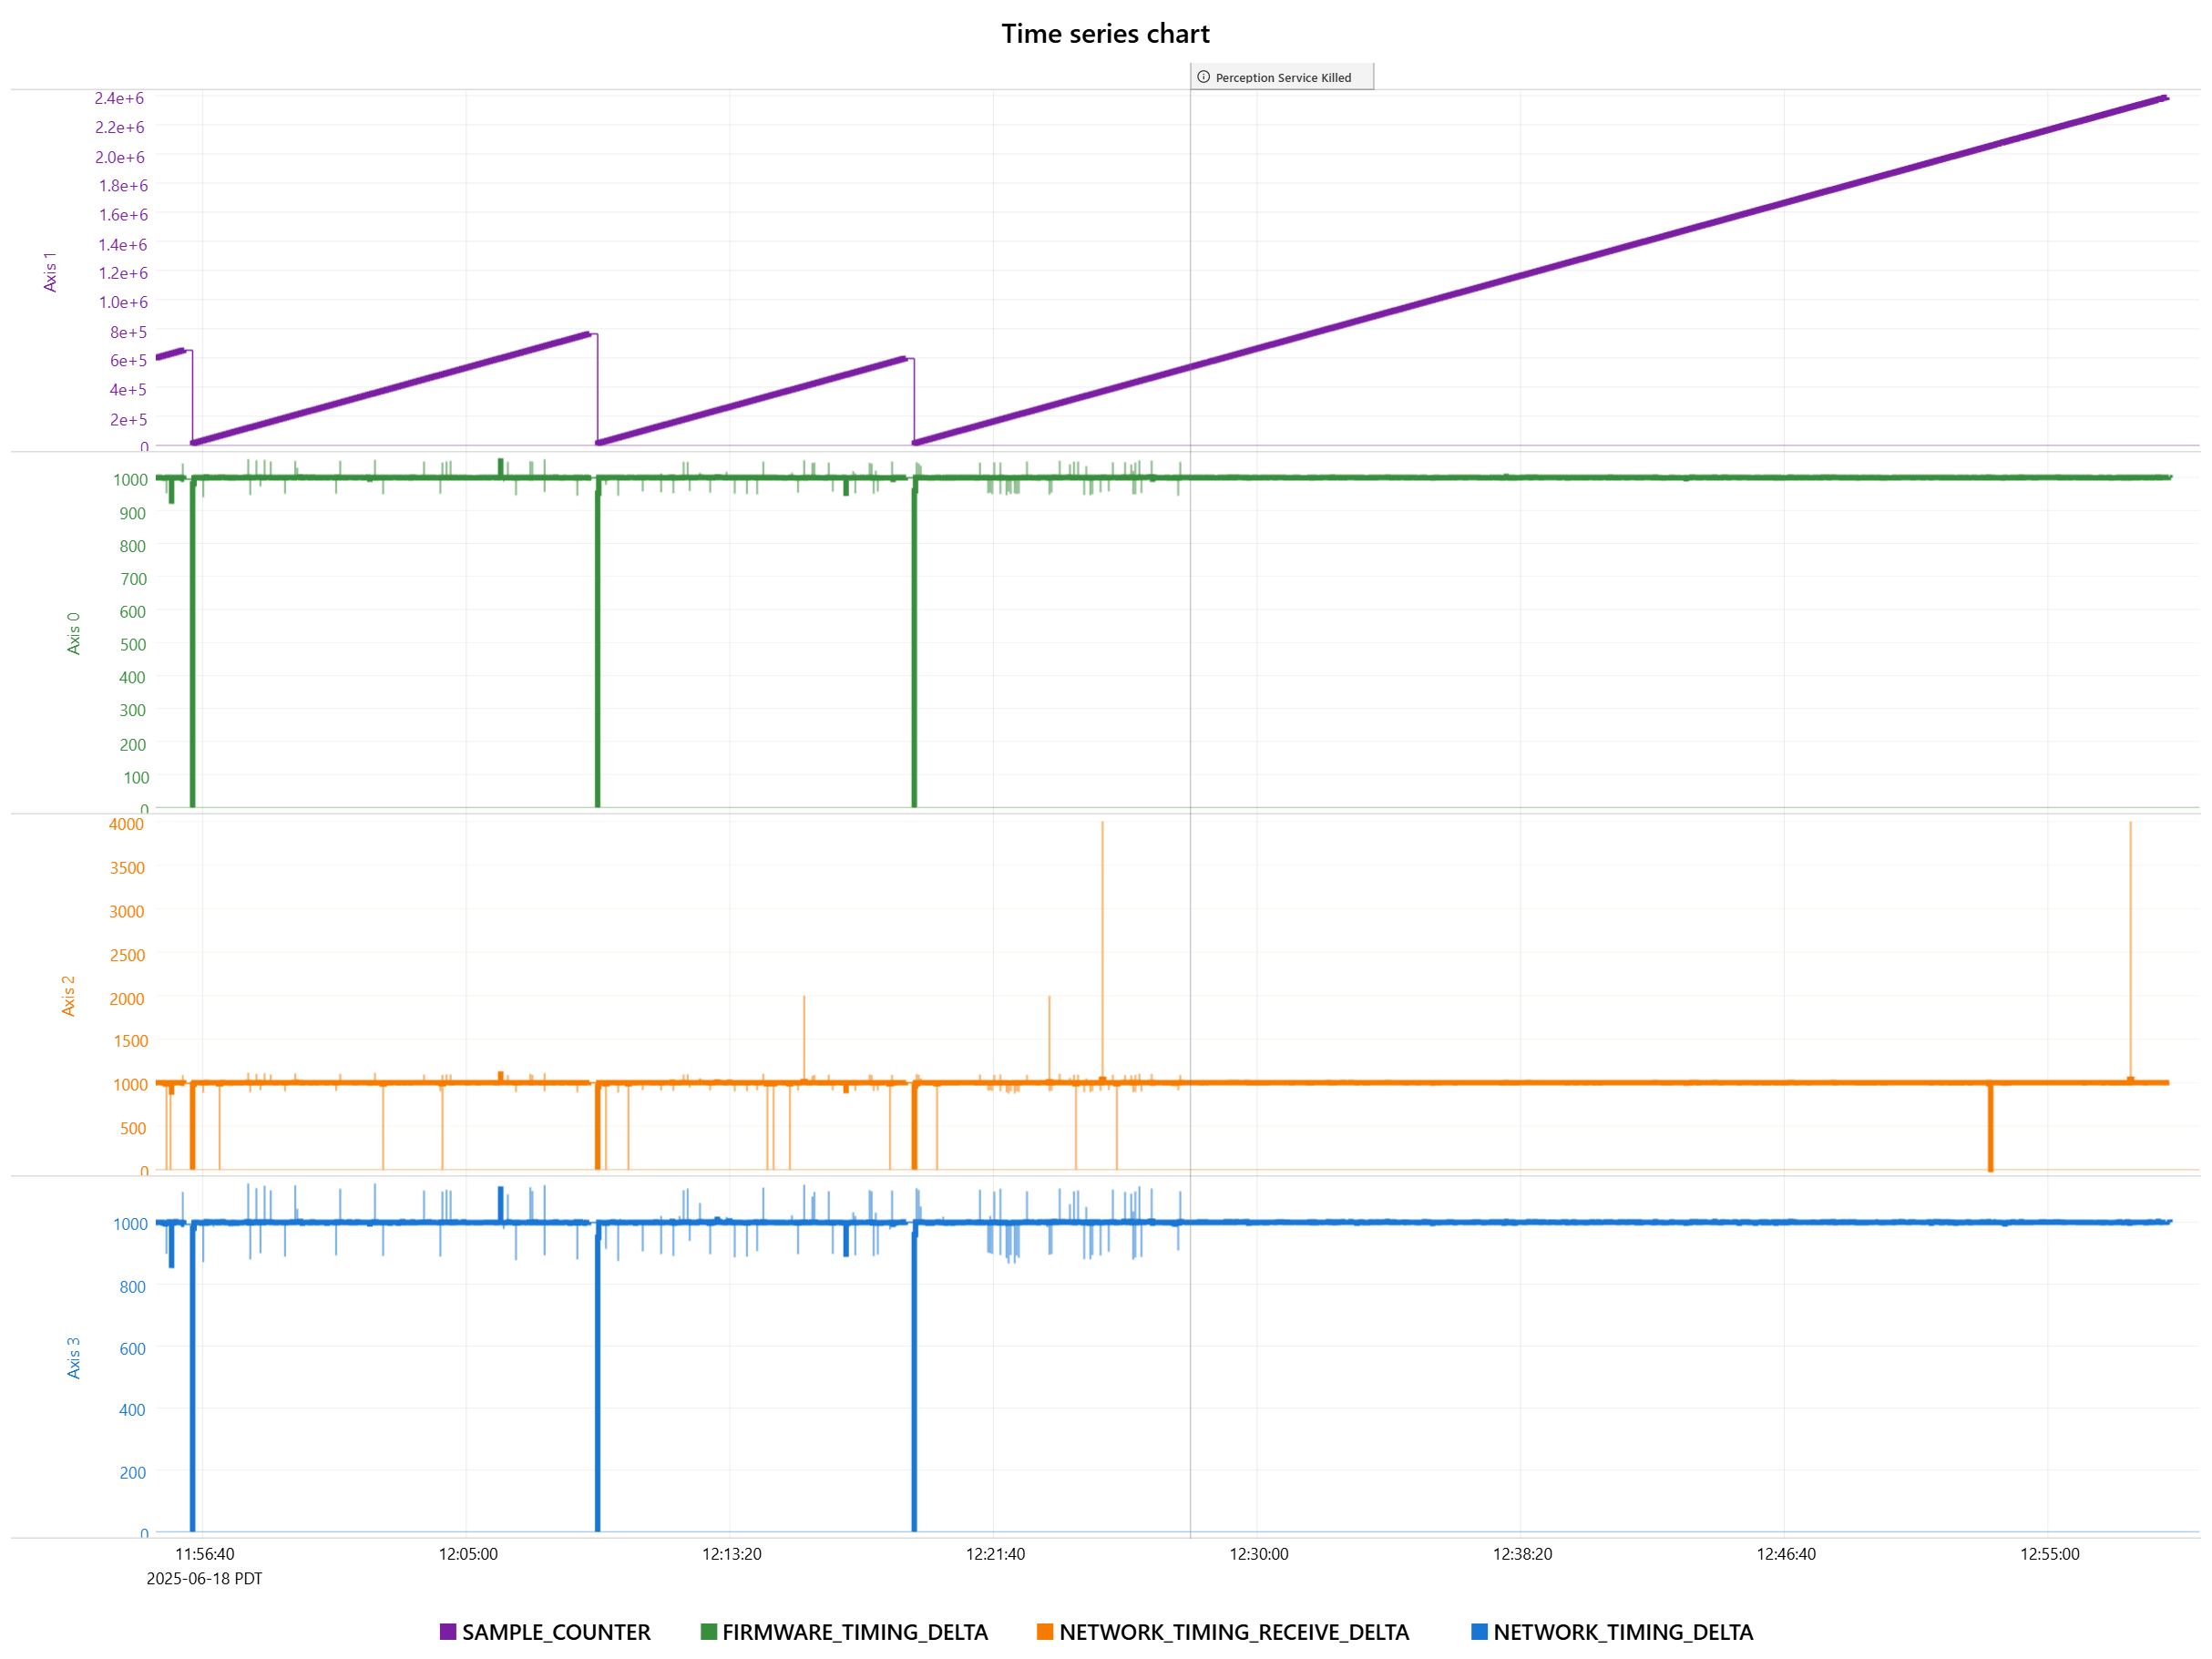
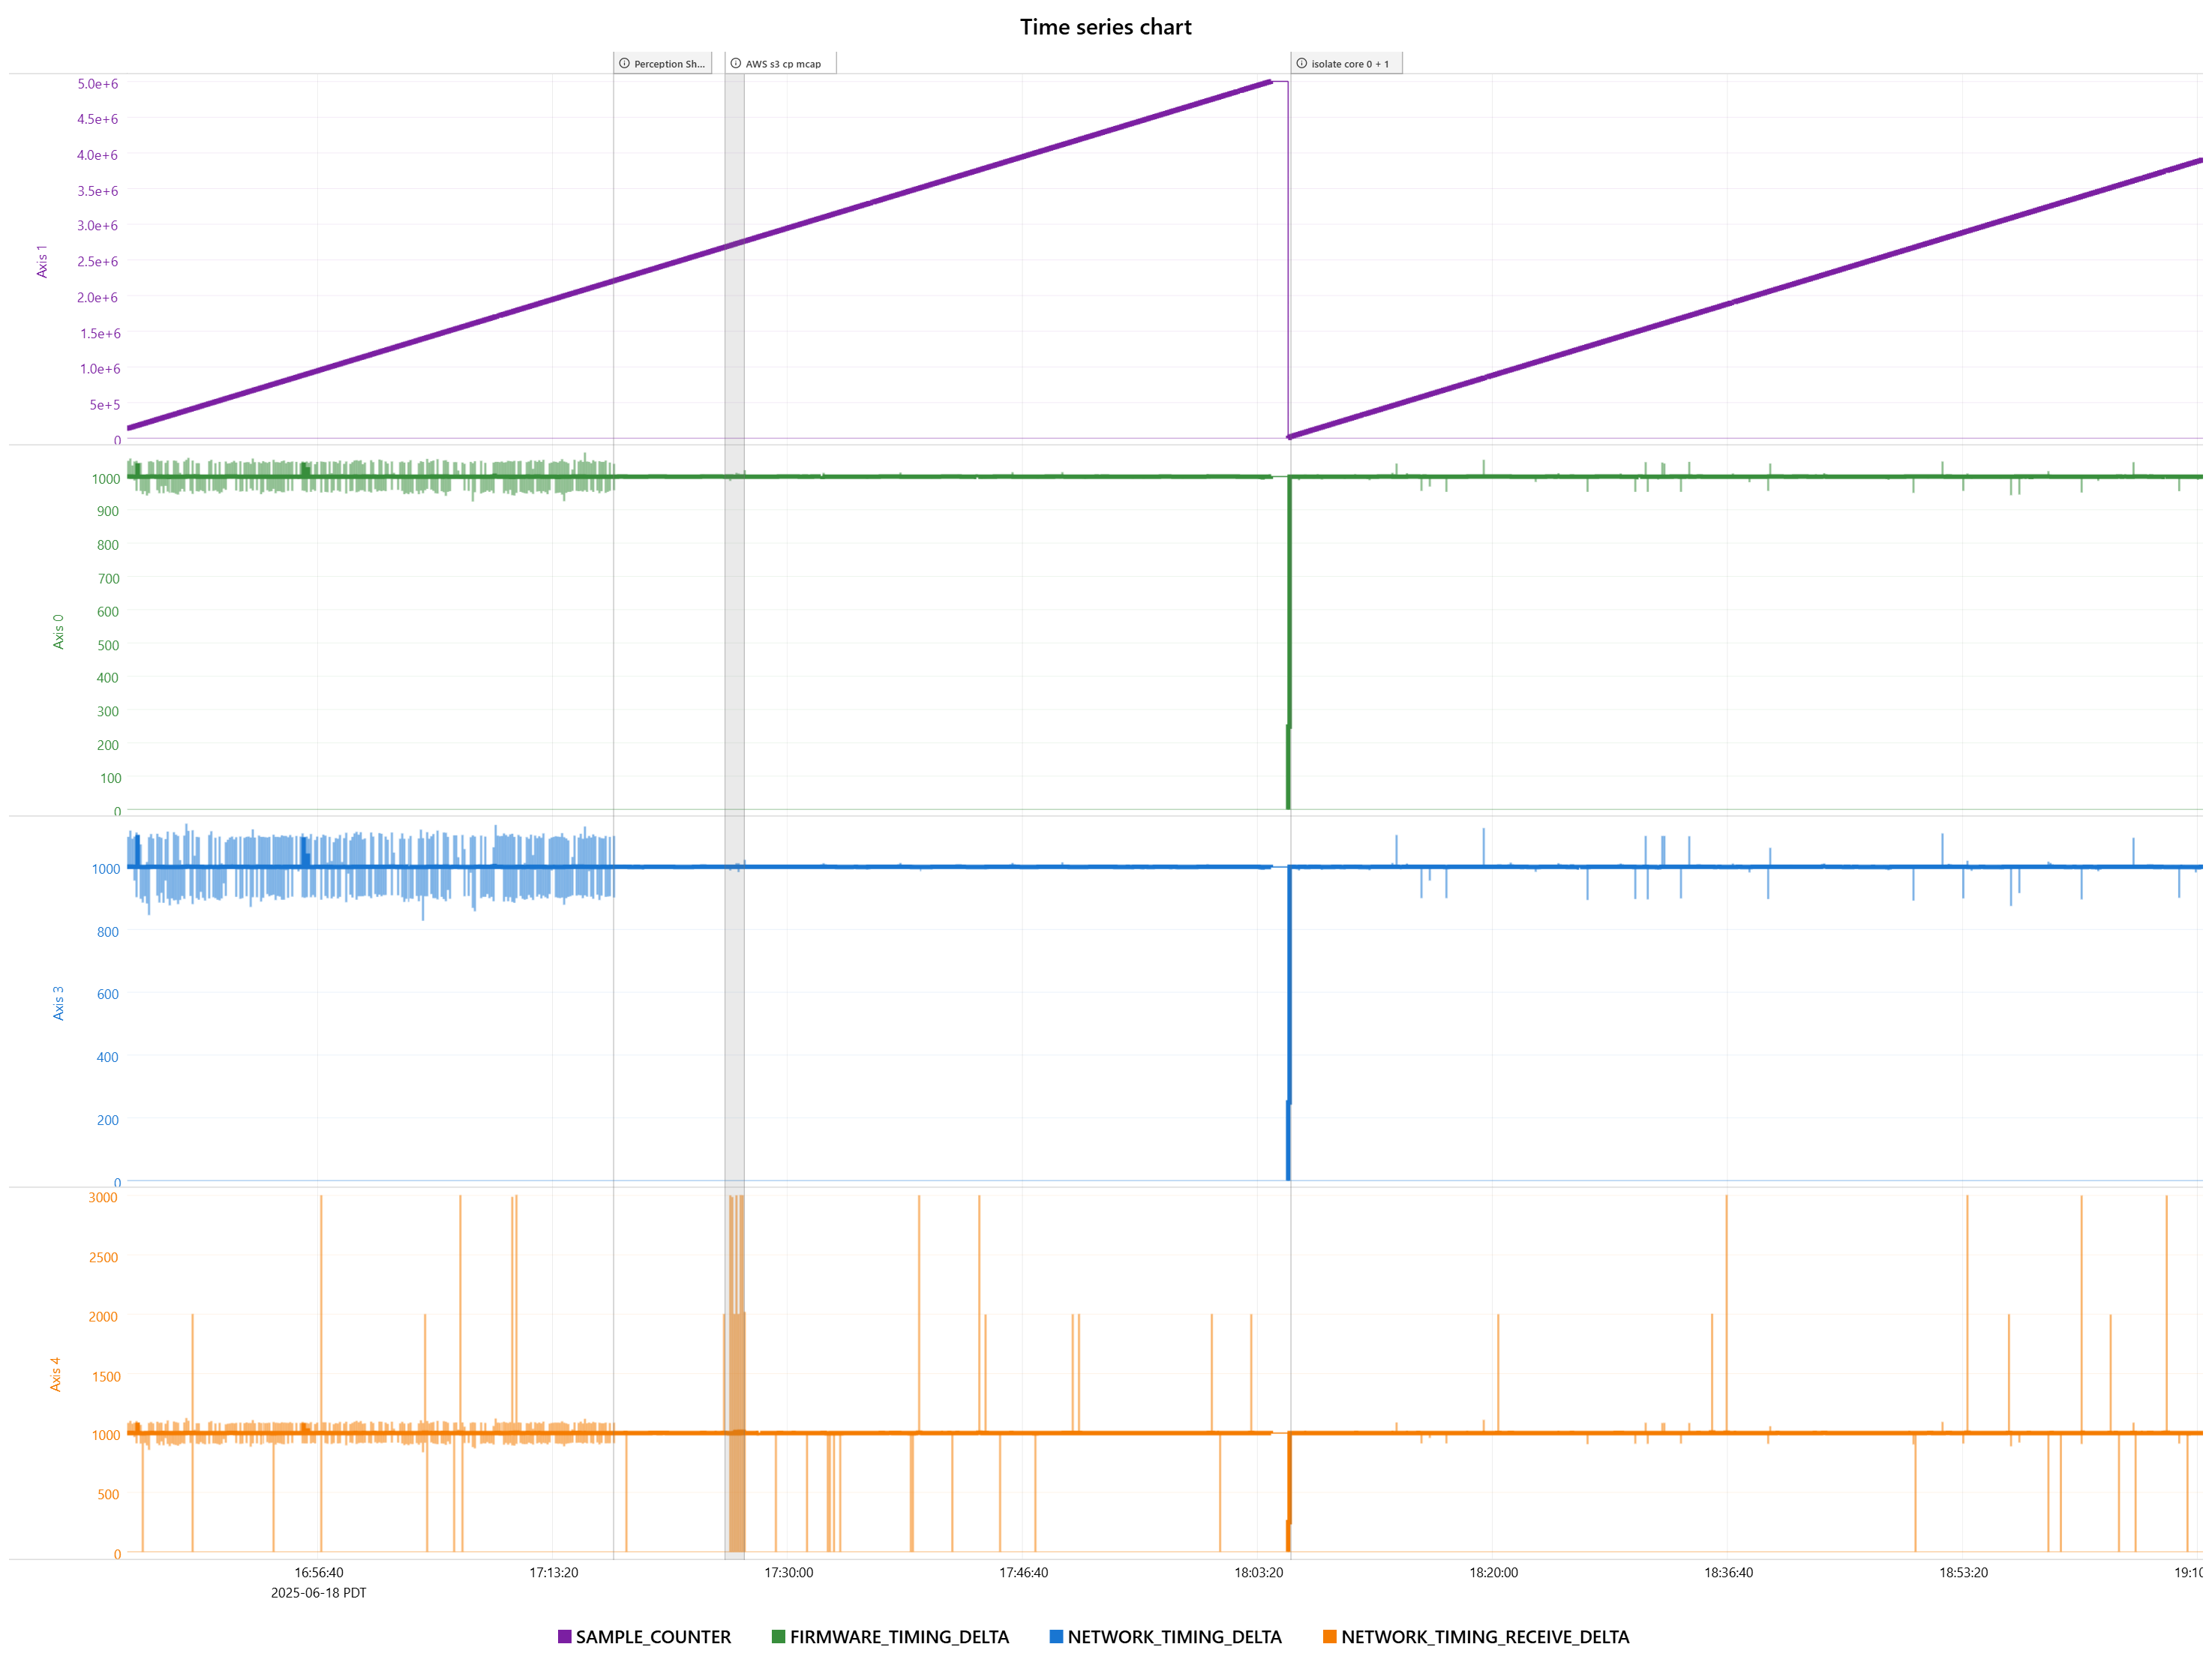
Here is a graph of data our recorders are capturing during one unusual failure mode.
The sample counter continues to increment but the network timing delta + receive delta drop to 0 and stay there.
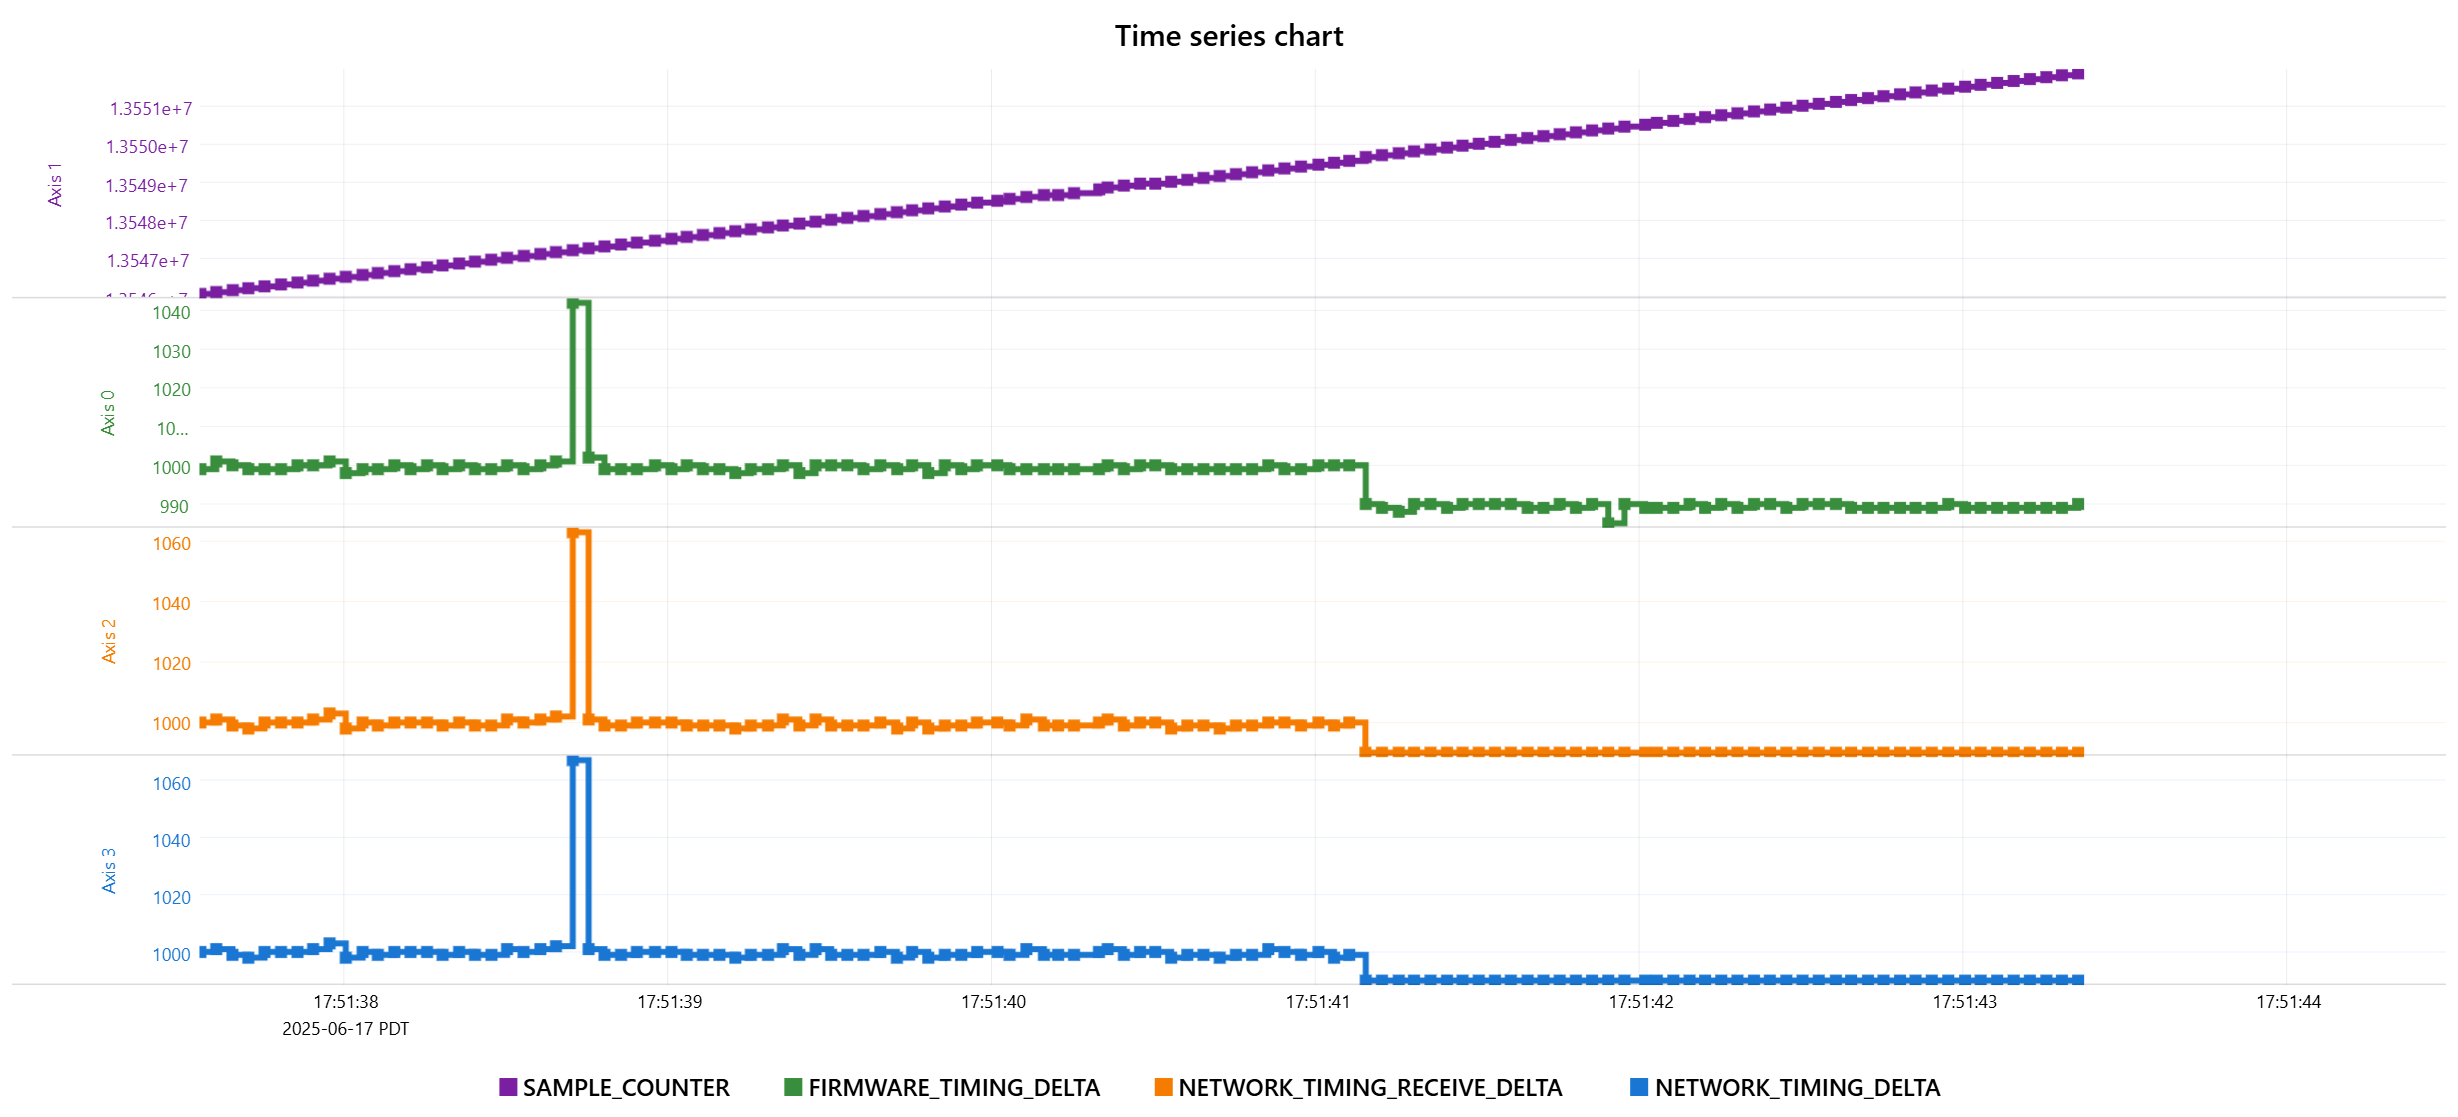
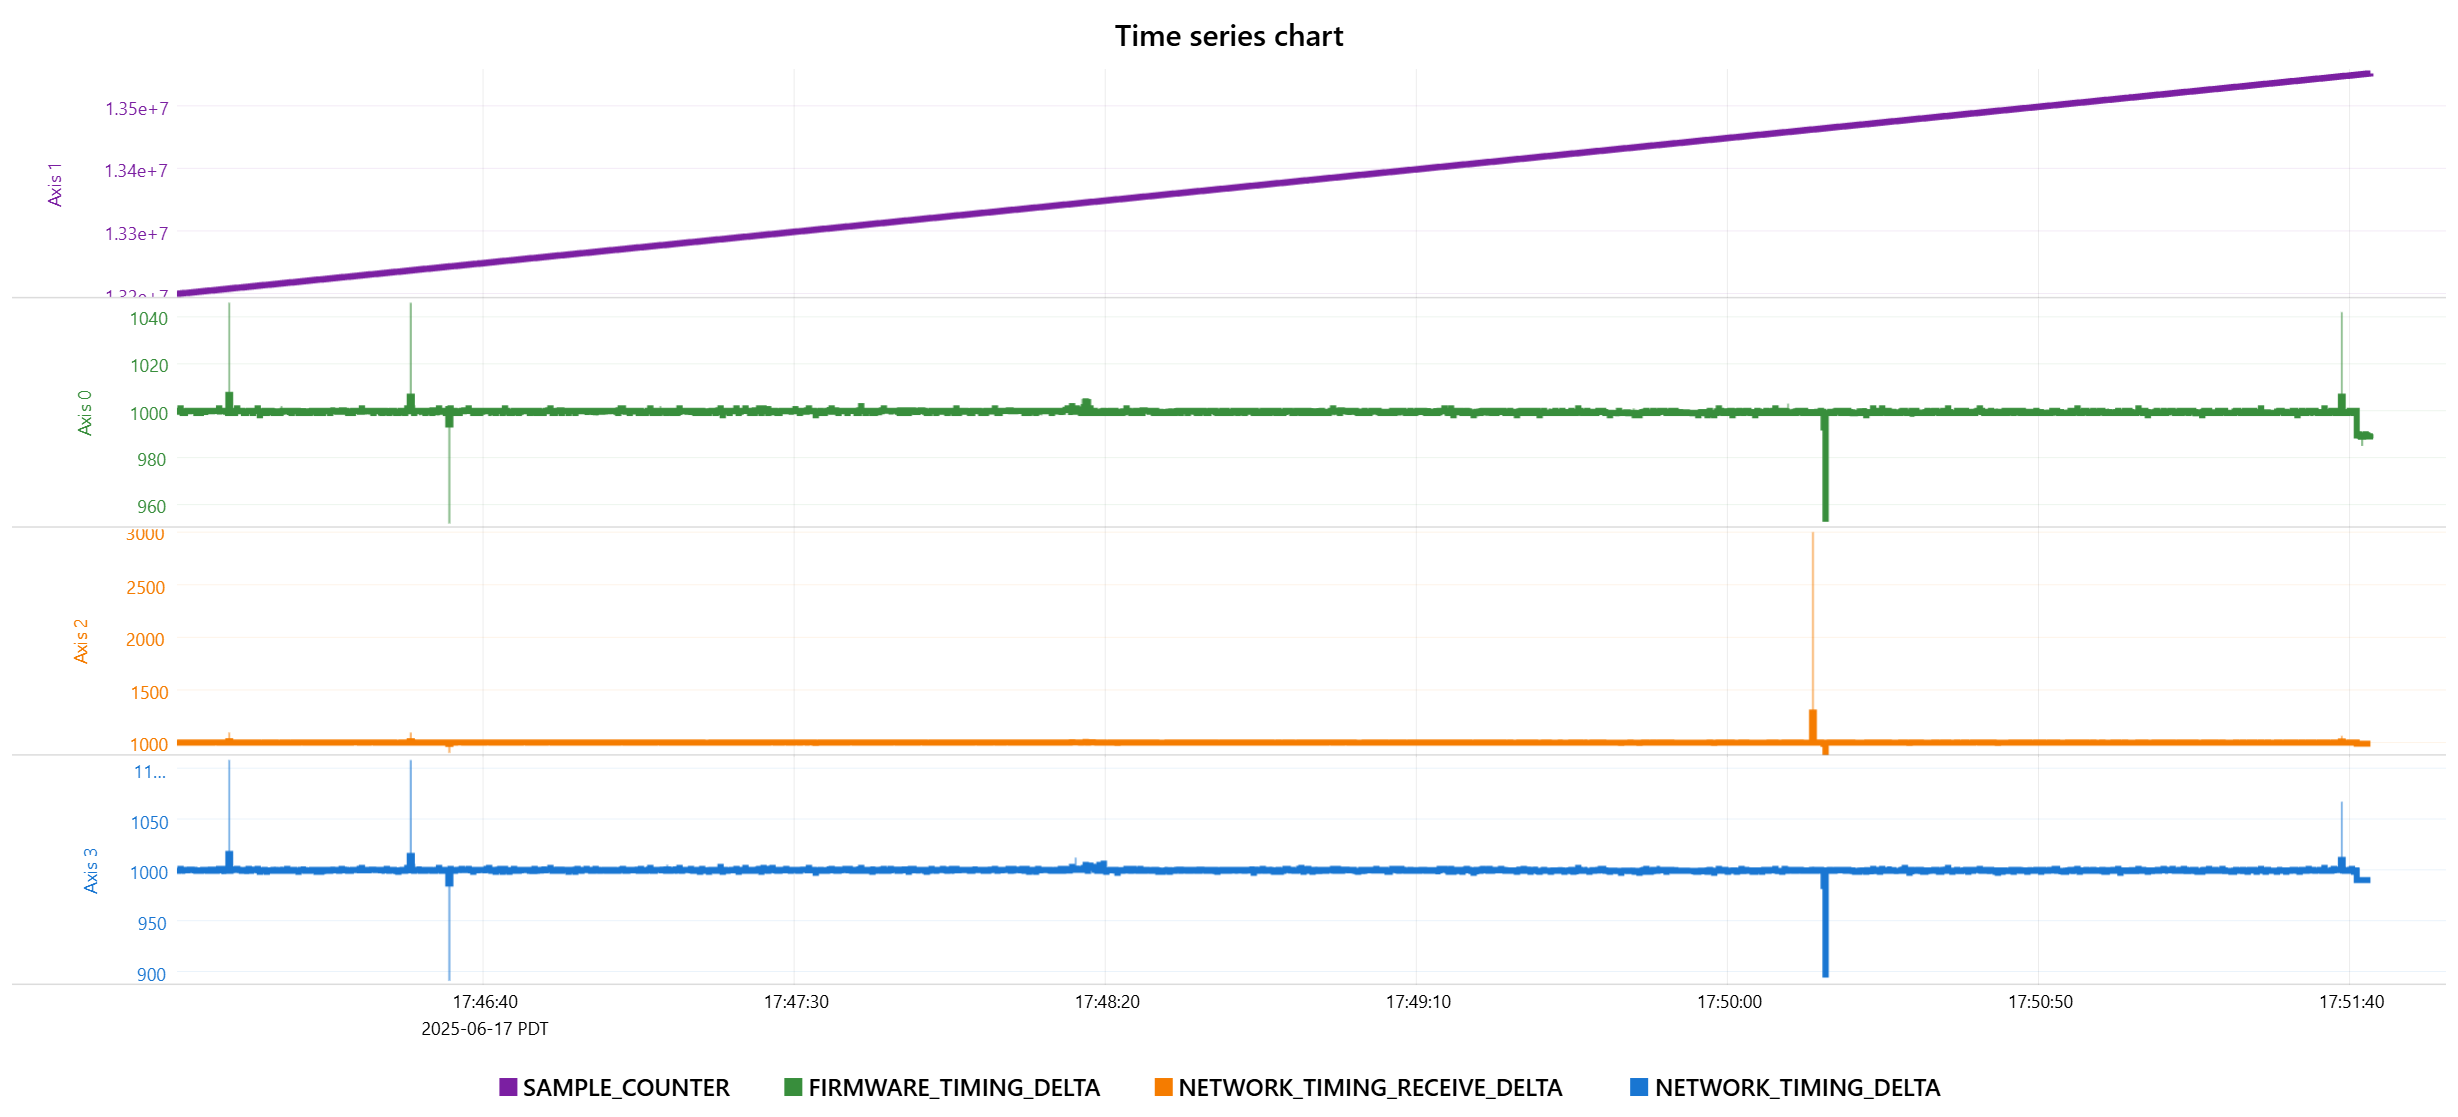
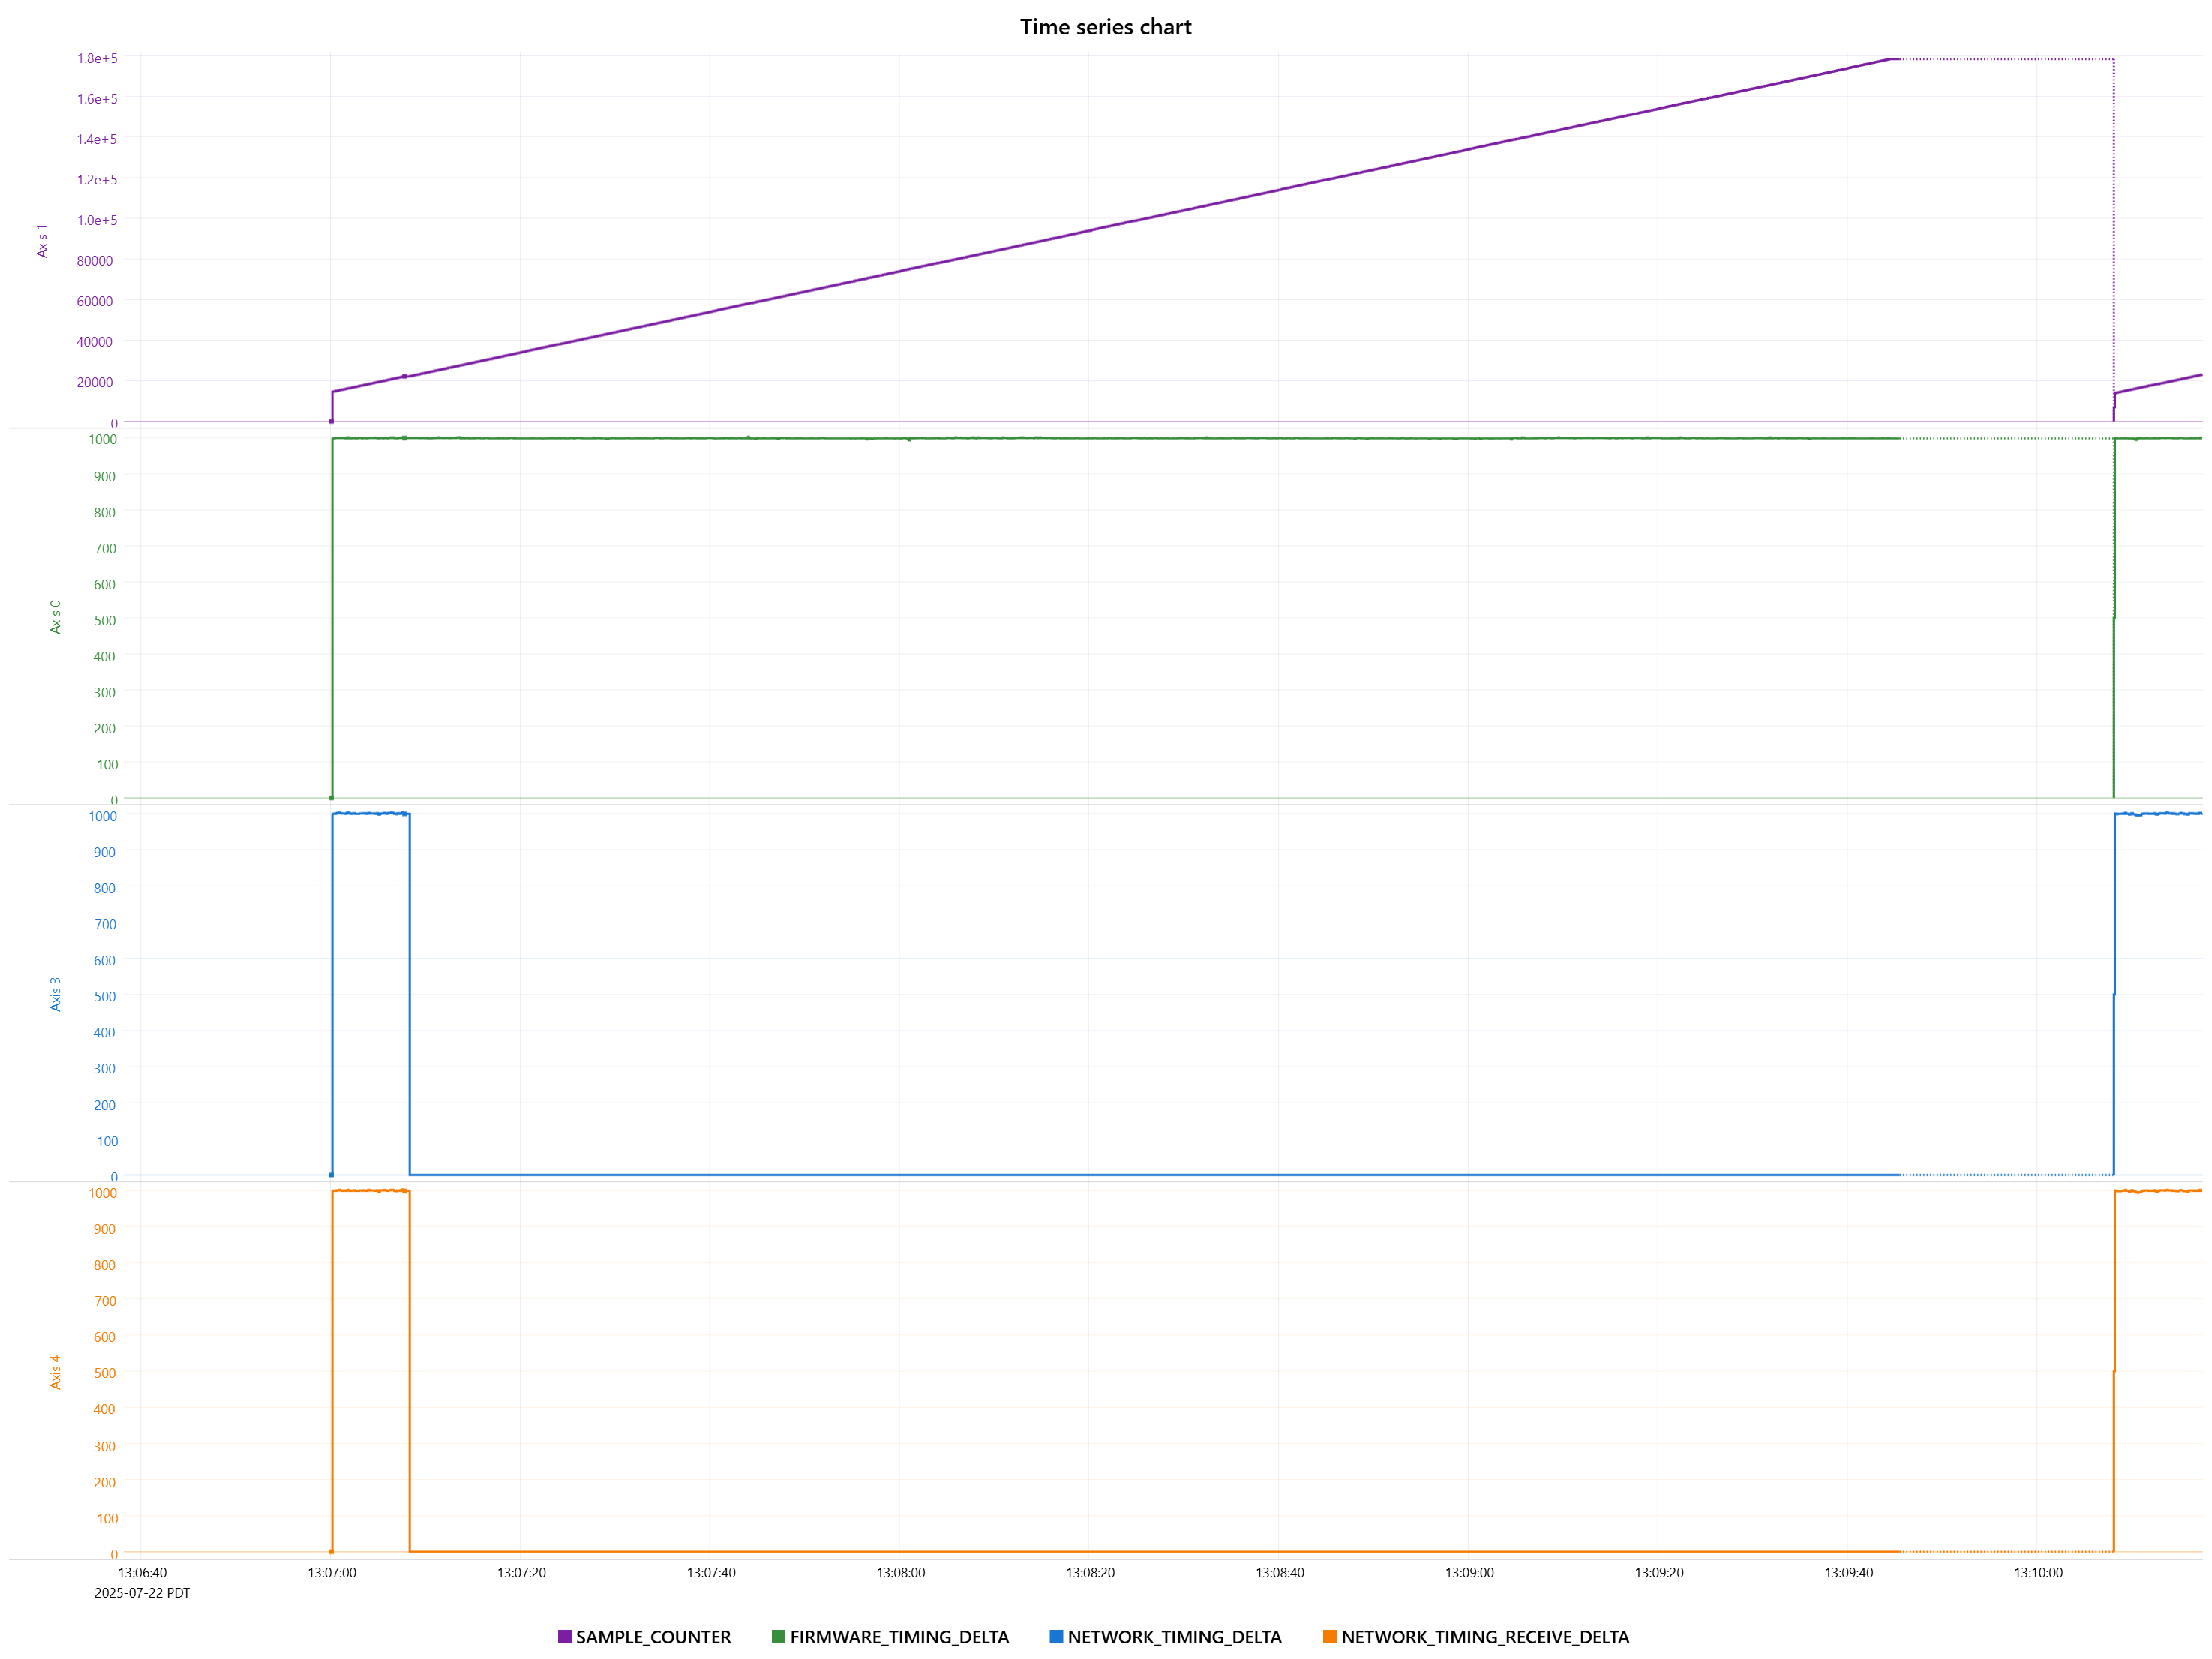
Some additional data on a potentially related failure mode. RMP starts healthy, but at some point NETWORK_TIMING_DELTA and NETWORK_TIMING_RECEIVE_DELTA flatline at a nonzero value, SAMPLE_COUNTER continues to increment and FIRMWARE_TIMING_DELTA shows normal jitter.
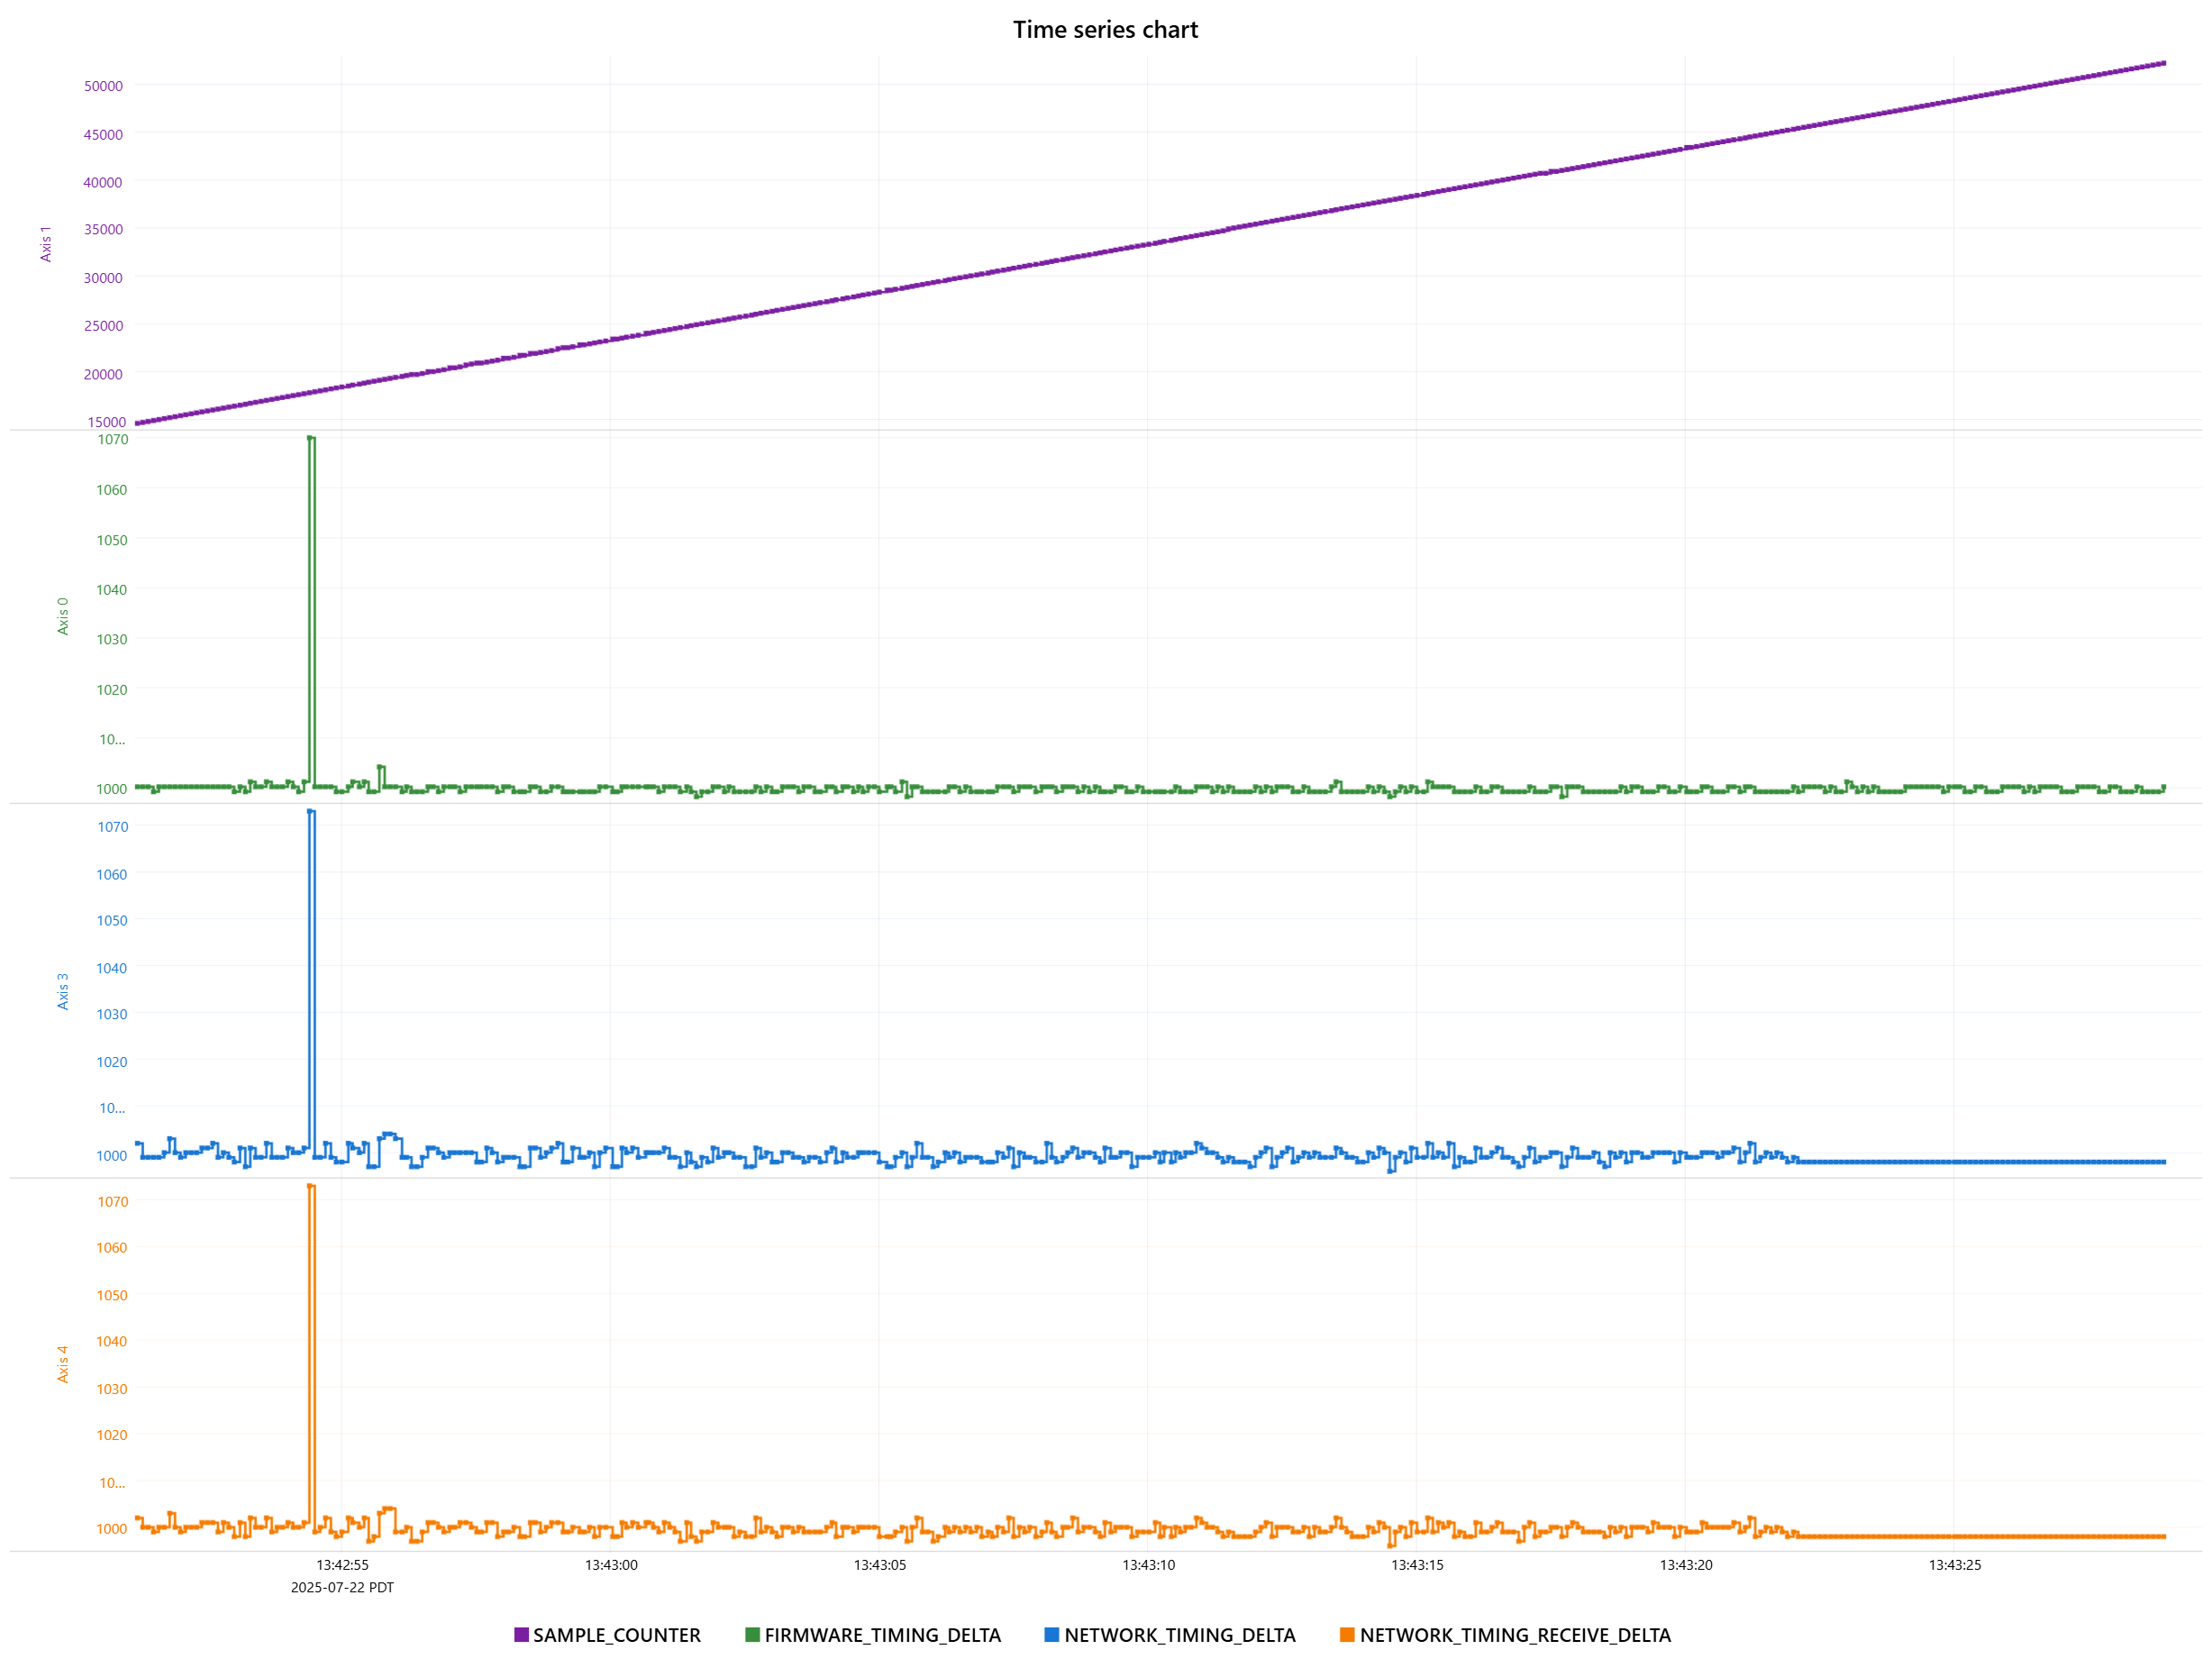
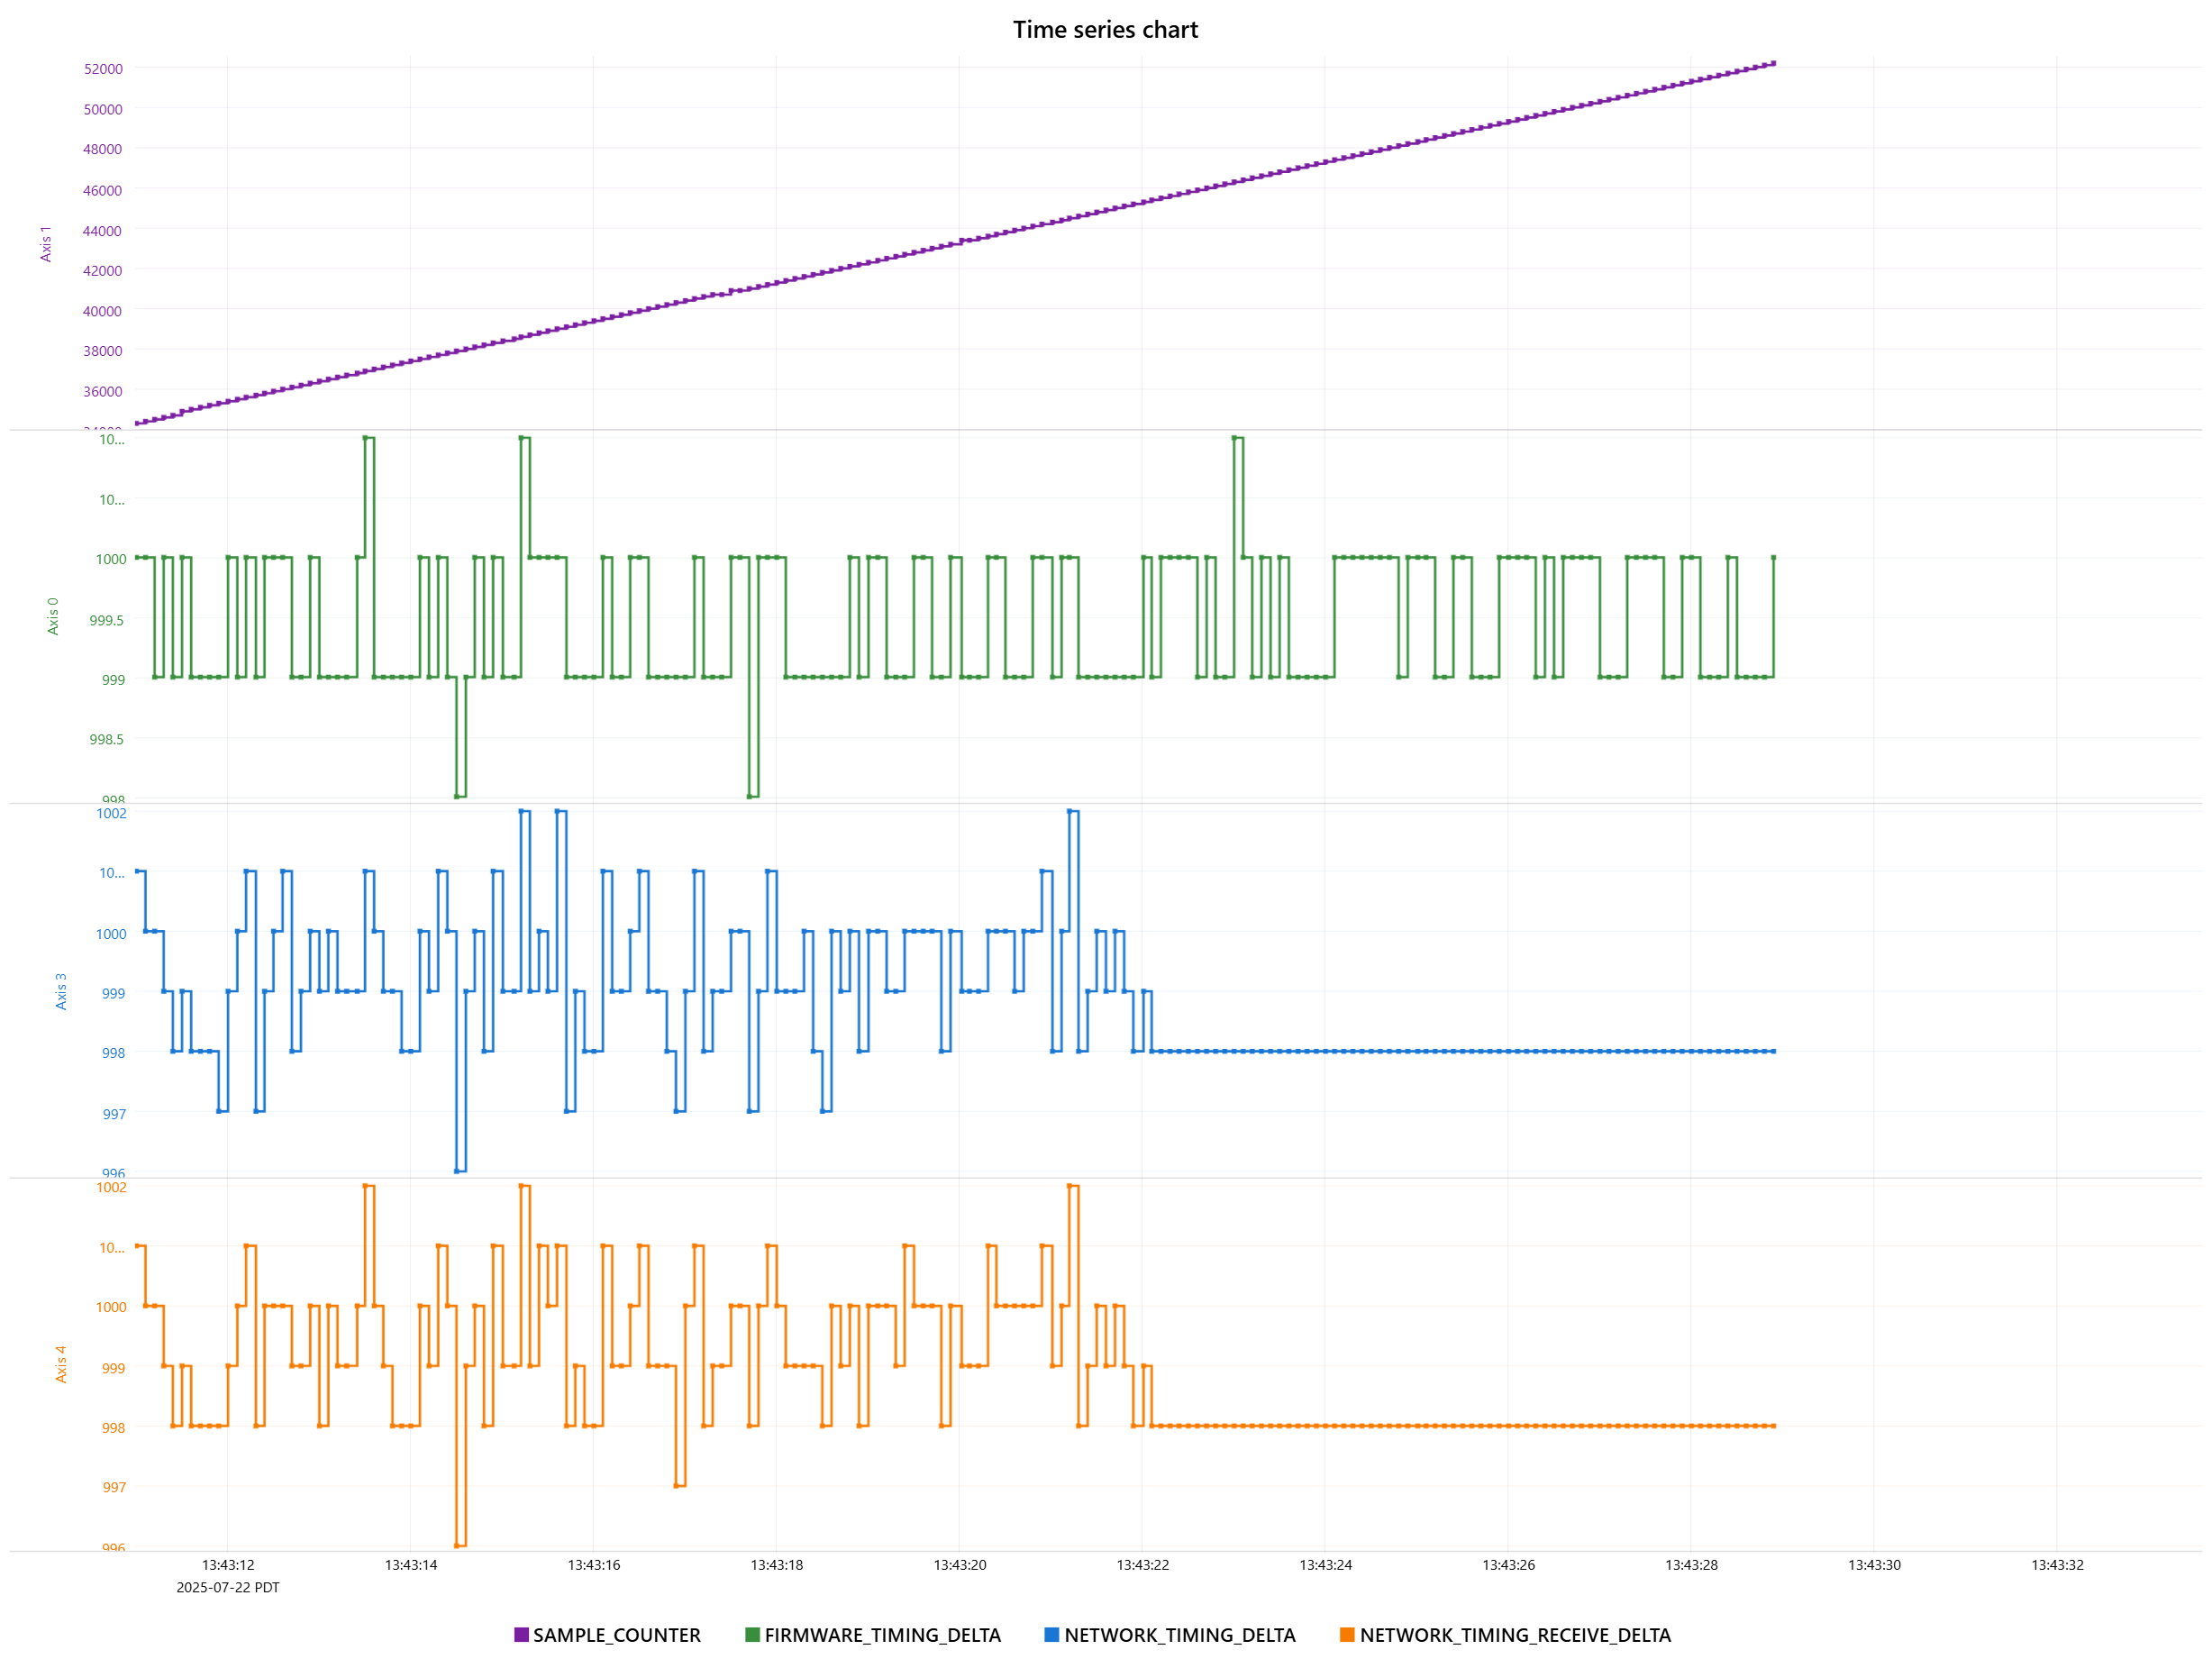
The magnitude of these errors seems like they should be within tolerance. 7% and 0.3% if I’m reading your graphs correctly. I wouldn’t expect this to cause the network to fail. I don’t have a good sense of the timescale on the bottom, but I want jitter to be less than 1/8th of the cycletime.
I don’t know much about your container setup and I’m afraid I’m a novice in this department. The SM connected one doesn’t update but Namazu being accurate is interesting. Is there is aspect of the attachment that might be flawed? Lets consider that solid though. If you try the NetworkCounterGet() or more generally other MotionController calls do they still operate as expected after a crash?
@scott NetworkLogMessageCountGet() has been returning zero when we check it. And we don’t check it if IsNetworkOperation() returns true.
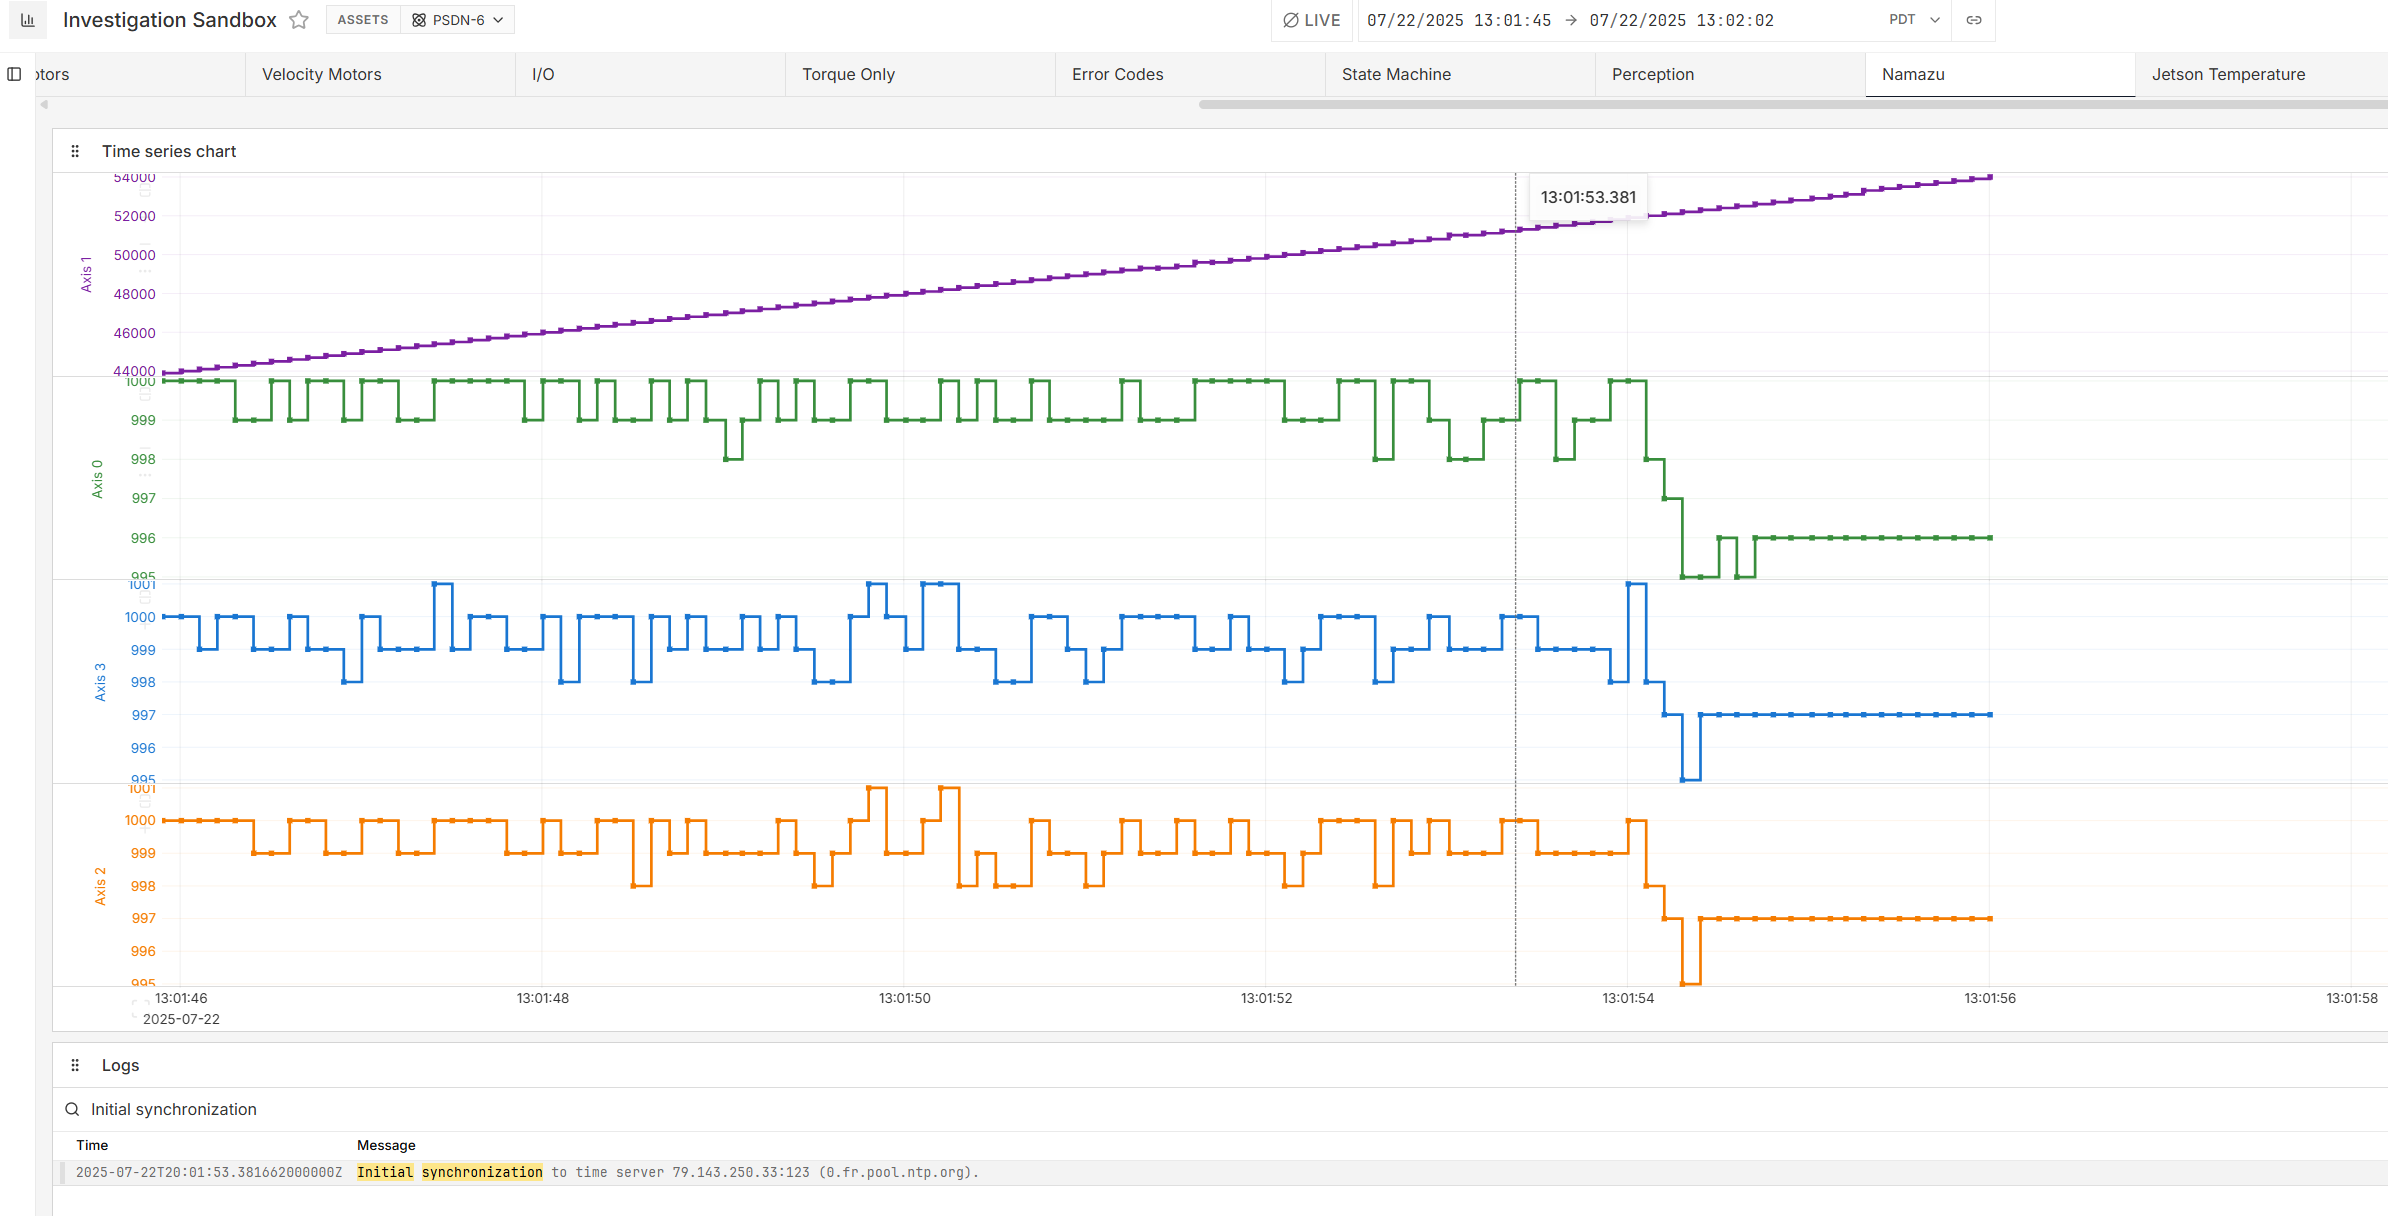
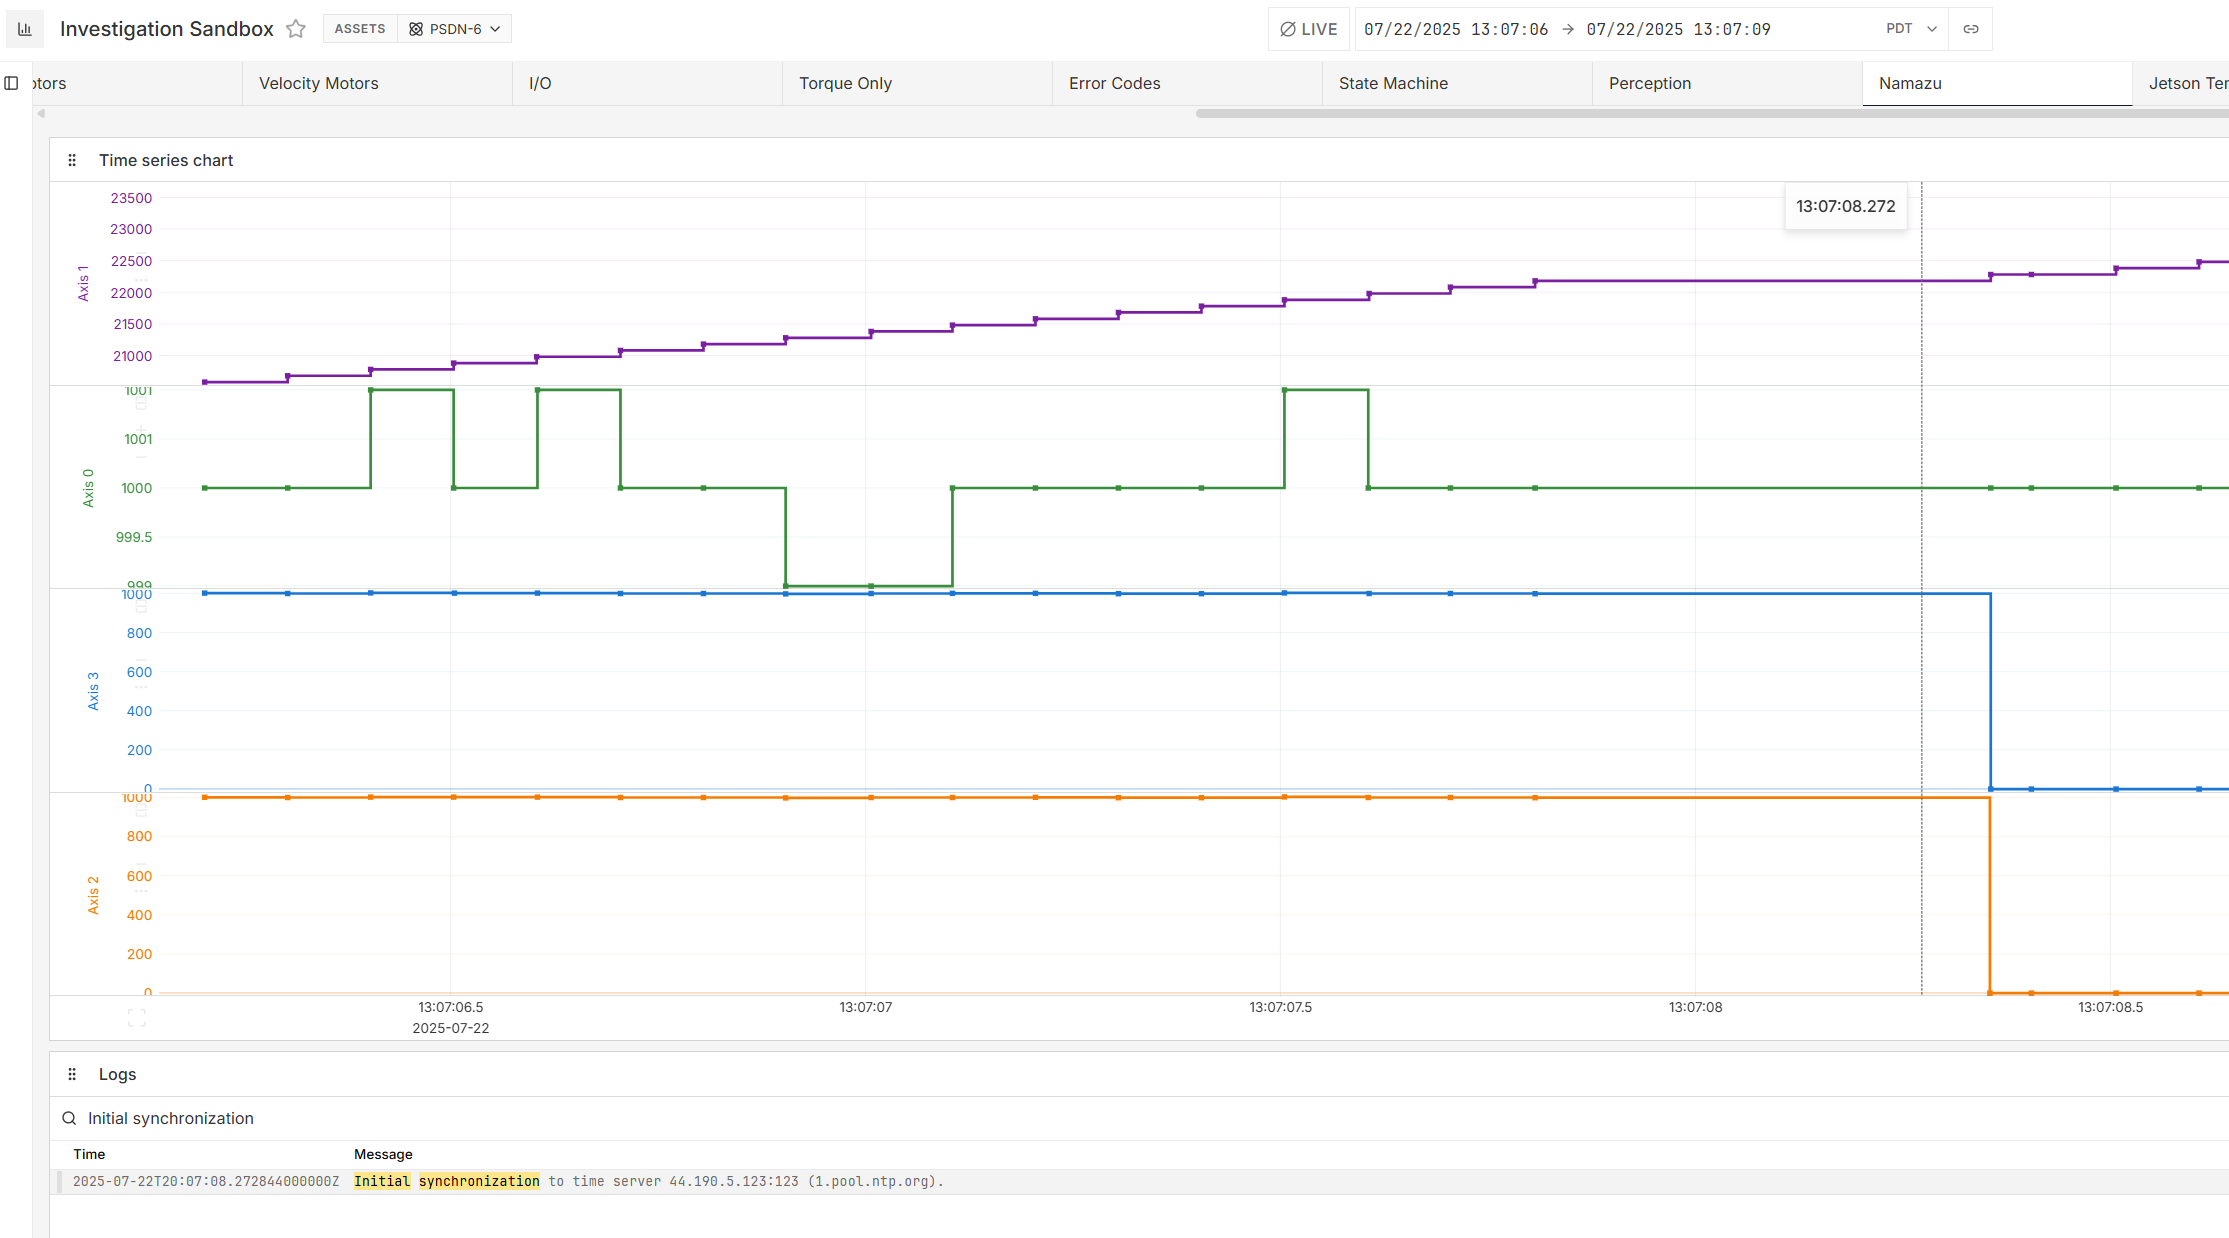
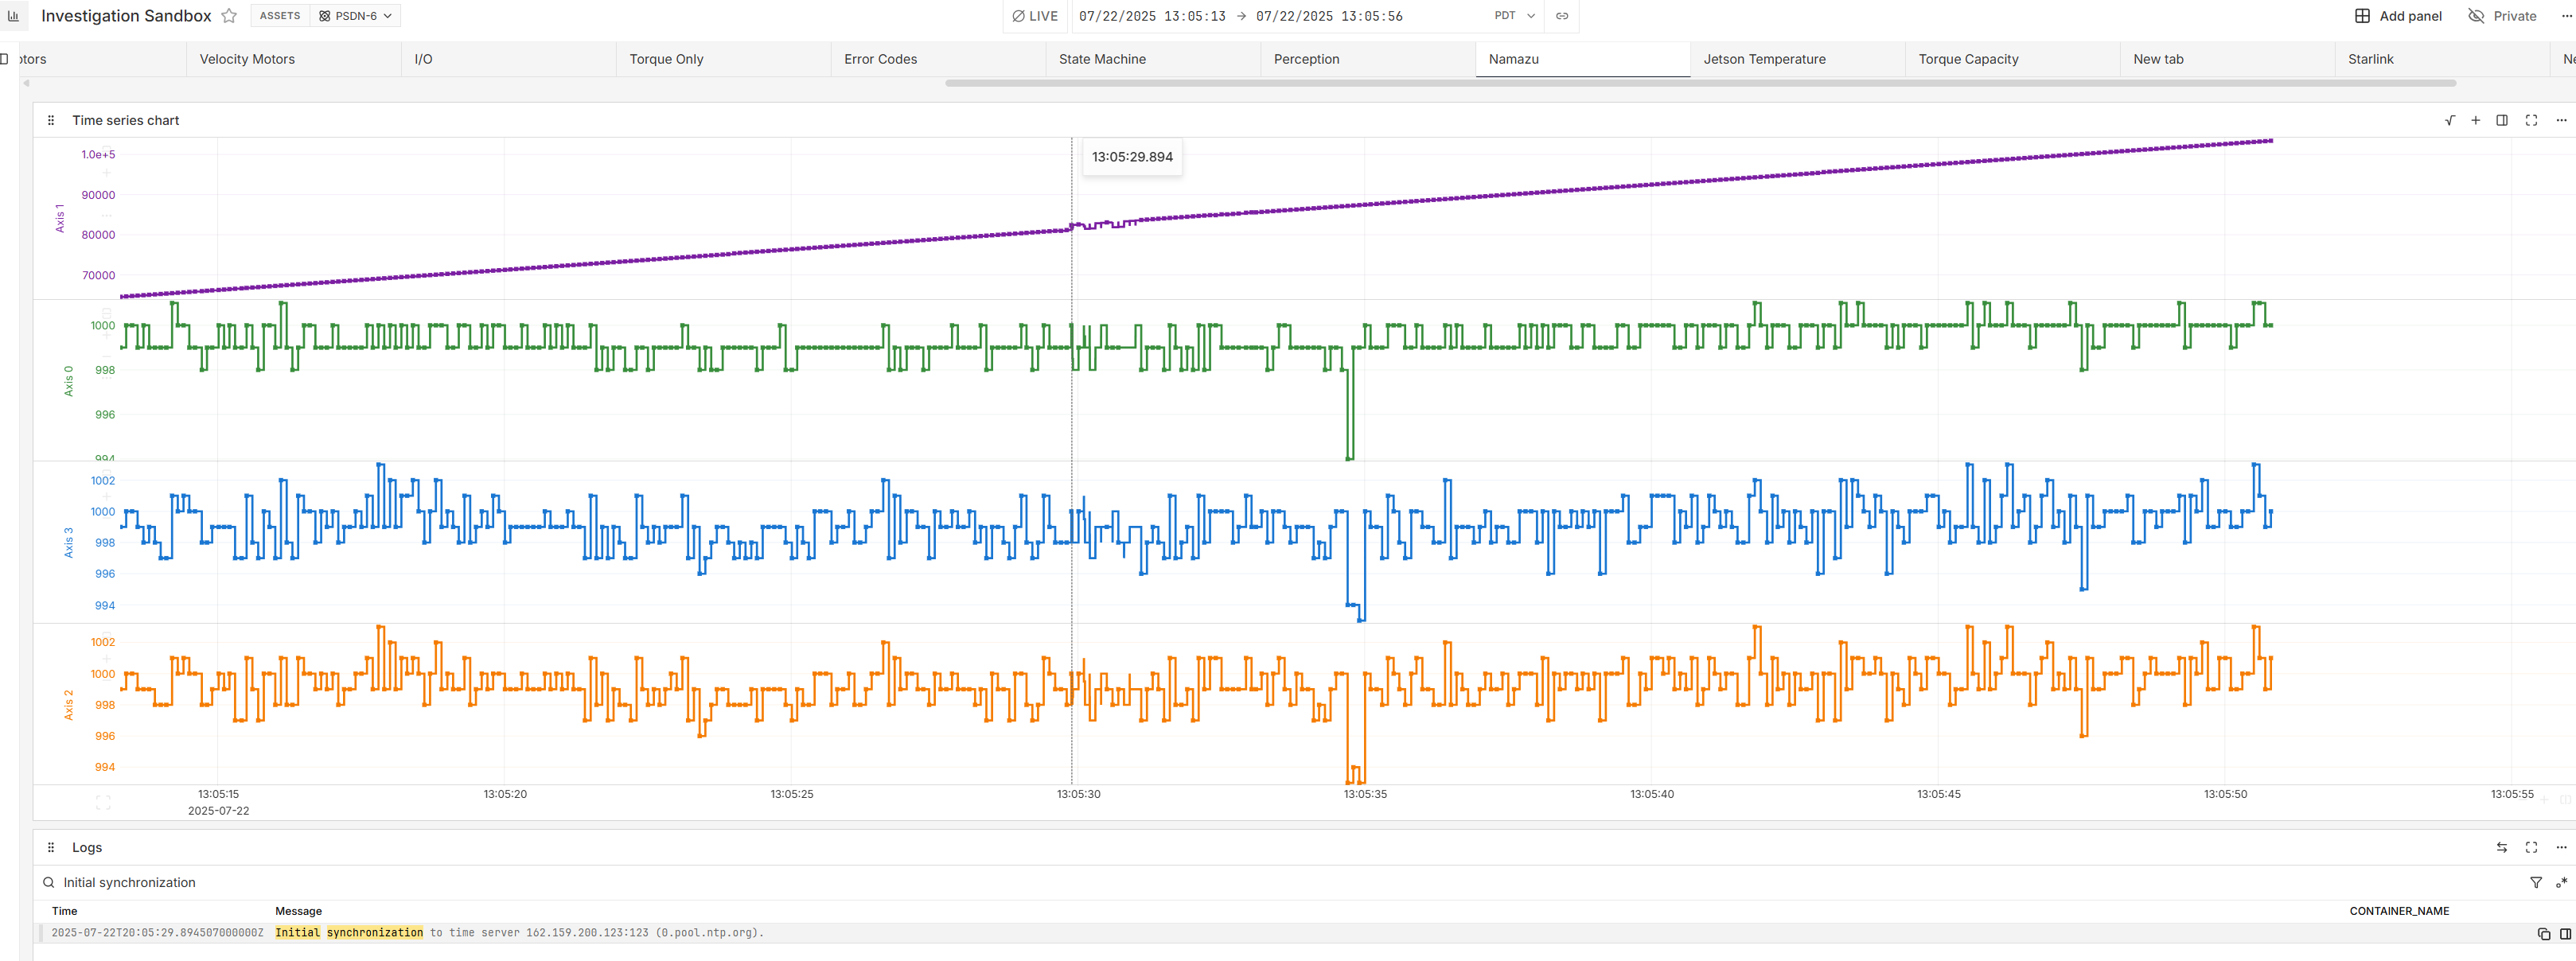
With that said, I was able to sync some journald logs with our data and found something very interesting. Right before each of these crashes, our machine synchronized to an ntp time server. Because our machines are deployed on boats connected to a starlink dish, it is common for docker containers to start up before the starlink has stabilized the internet connection.