I’m seeing an issue that’s similar to a previous post: User Limit (Immediate) Re-Use. (a problem I can still reproduce, BTW)
I want to know when an axis is inside a certain region. I have two user limits set aside for this purpose.
One triggers when you enter the region. The handler for that one configures the other user limit for when you leave the region. The handler for that user limit (re)configures the first.
These are both configured as single-shot.
The queer behavior I observe happens when I’m sitting right on the boundary between inside and outside. It seems like a slew of interrupts are generated, even though the user limits are always configured to be single shot. The motor is enabled, but it flickers 0-4 counts while it’s commanded to be at the boundary position.
If I look at the sample counter for when the interrupt was created (using InterruptSampleTimeGet), I will see thousands of interrupts (that have been queued, I suppose) that trigger my handler even though the user limit that’s being triggered is a single-shot and is (presumably) no longer enabled. What’s more, the sample number for those interrupts is before the current sample (obtained from SampleCounterGet) when I configure/enable the other user limit.
In my application, I see the “inside-the-region” handler being invoked upwards of hundreds of times in a row. Then, after a couple seconds, I see the “outside” handler being invoked many times in a row. I would have expected it to alternate between inside, outside, inside, etc. for flickering actual positions at the boundary. The sample numbers (interrupt sample vs current sample in the handler) really begin to diverge as time goes on, as if the interrupts were generated long (seconds) ago.
It’s as if a bunch of interrupts are being queued, but I only expected a single one (single shot).
Are my expectations wrong?
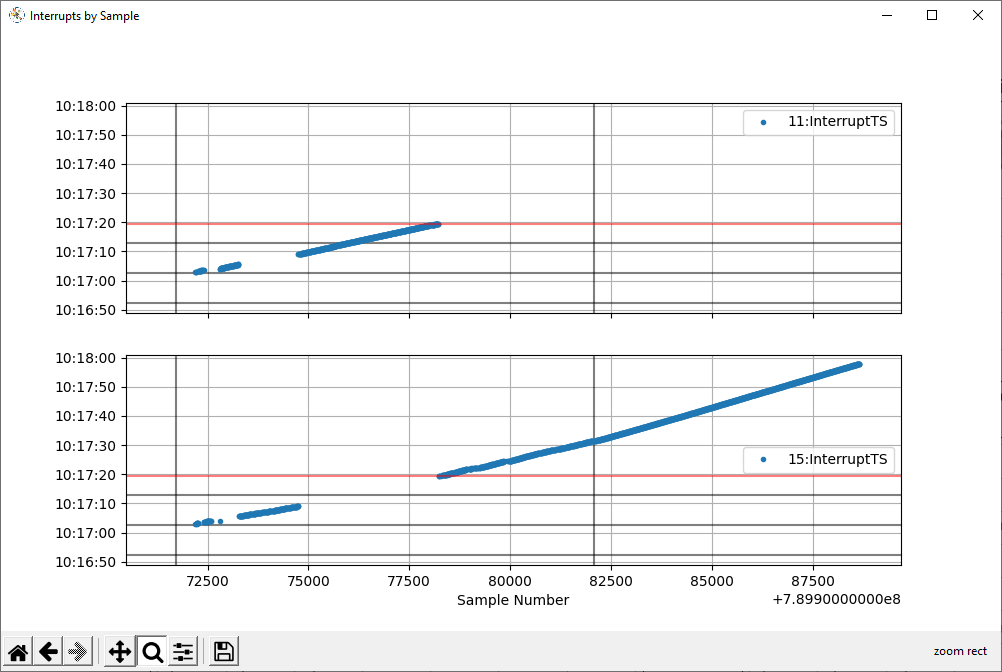
This is a plot of interrupt sample number vs time-when-handled. The leftmost vertical black line is when I commanded the axis to move to the target position (the edge of the region). The move might have taken half a second to execute. I waited 10 seconds, then (the rightmost vertical black line) moved it outside the region by a small, but sufficient amount. Again, a quick move.
User Limit #11: “inside”
User Limit #15: “outside”
The horizontal red line represents the calendar time when the last interrupt was generated (not handled). The vertical axis represents when the interrupts were handled. It’s probably a coincidence that the “inside” interrupts stopped getting handled right around the time that the interrupts stopped getting generated.
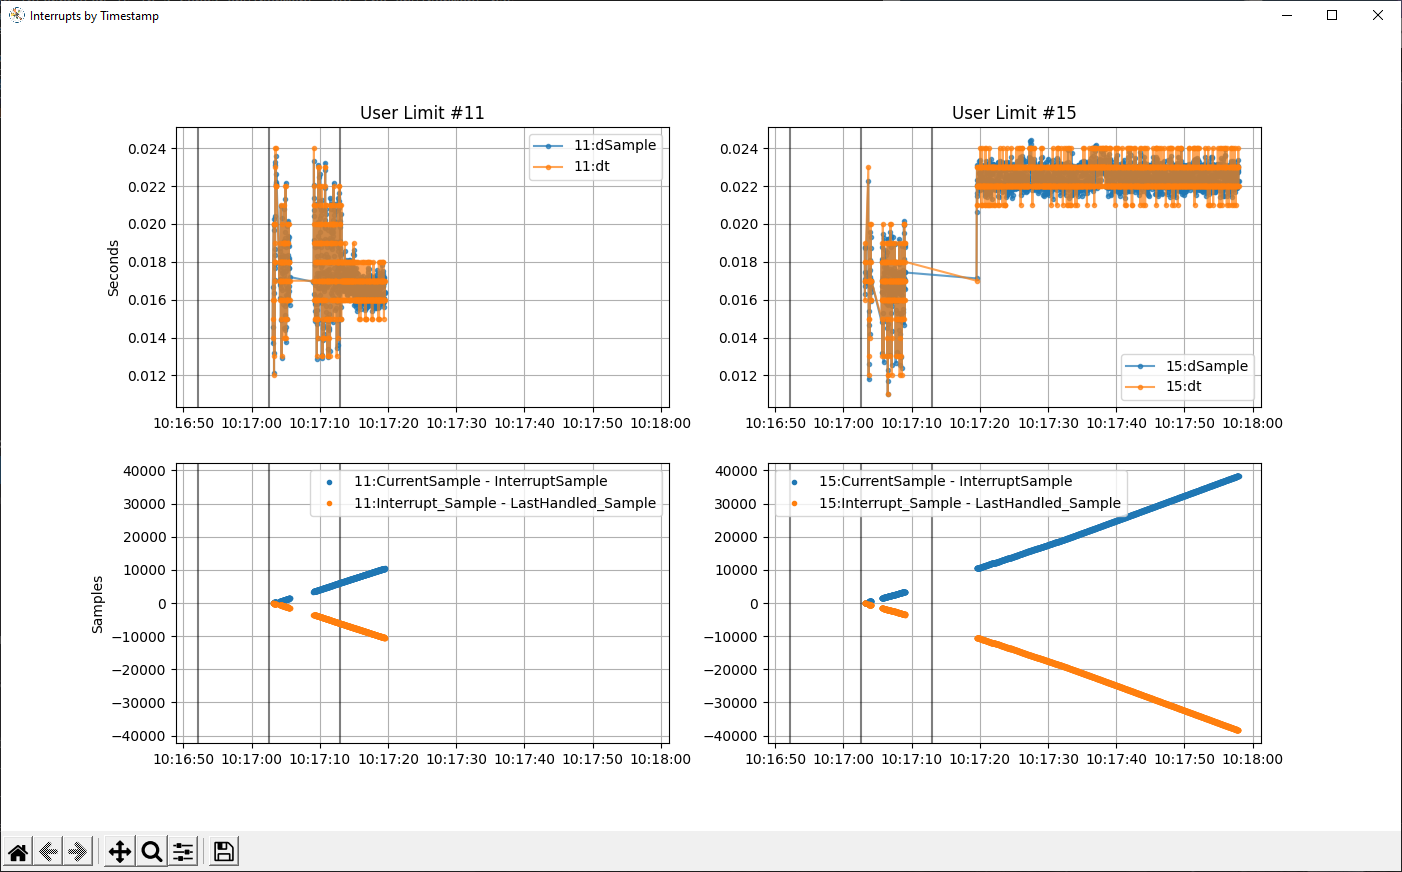
That whole time, a bunch of interrupts came in, but the difference between the sample number when the handler last processed an interrupt and the interrupt sample number grows. In this example, the time disparity is upwards of 40 seconds (due to the length of time it takes my handler to run, presumably). This is what leads me to suspect that I’m processing long-queued interrupts.
The bottom two plots show the time the interrupt was handled vs:
the difference (in samples) between the current sample and when the interrupt was generated
the difference (in samples) between when the handler was last invoked and the interrupt was generated (note that the interrupts I’m handling were all generated before the previous handler was invoked, so they don’t seem to be coming in as the result of something the previous handler did).
(I’m sorry the data I have is not specifically organized for this issue, but it’s what I can do without drastically redesigning my app.)
To answer your primary question, you should expect only a single interrupt if you configure a user limit as a single shot. We are currently working to reproduce this behavior, and will reply with our findings as soon as we can.
Here are some other details that may be pertinent, though I have no reason to think that they are.
Drive 0-2: CTB MAS-D3
Drive 3: Yaskawa Sigma-V drive/motor
My computer is connected to the network via a 100’ CAT5e cable.
The host/master is a high(er) performance machine with 7 cores. The CPU is never close to 100% when I observe this behavior (unlike some other problems I’ve reported on our lower-powered controls).
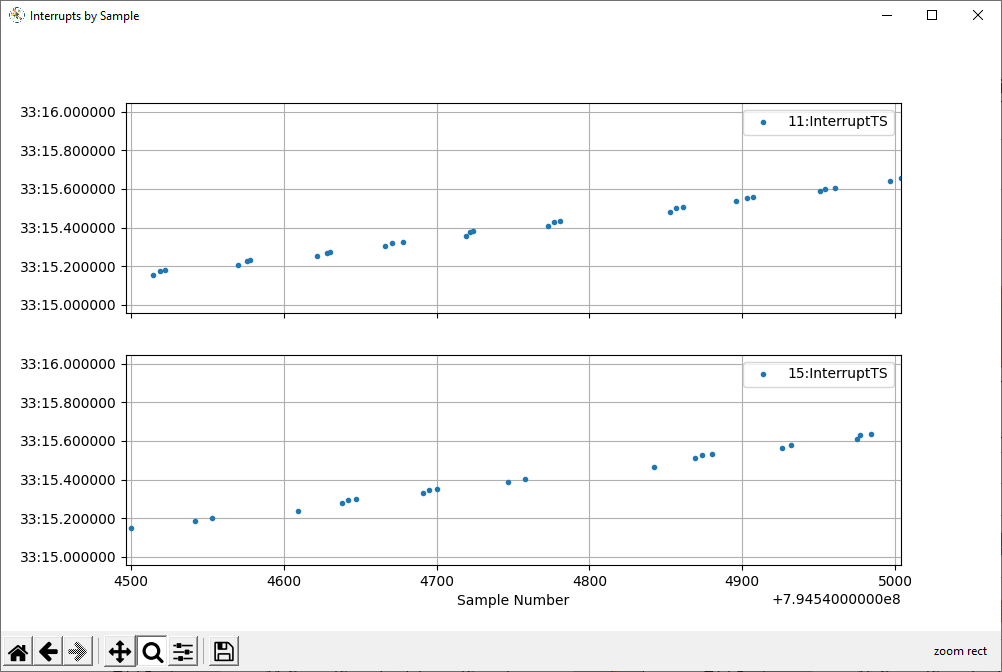
I added a check in each of the (“inside” and “outside”) handlers: if you were the last handler run, don’t reconfigure the user limit.
When I do this, I see better behavior, but I still see 1-2 “extra” interrupts come in (for which I no longer twiddle anything about the user limits for). Here’s a visualization. (#11 is “inside” and #15 is “outside.”) Note that the user limit for which the interrupt comes in alternates (more) between 11 and 15.
From some preliminary testing, we were seeing 1-1 correspondence between the number of interrupts and the number of calls to UserLimitConfigSet(). Can you confirm that the number of times you call UserLimitConfigSet() differs from the number of interrupts you are seeing?
When we set our user limit to reconfigure (call UserLimitConfigSet()), we do get thousands of interrupts. But, that’s because the conditions for the user limit triggering are being met immediately after being reconfigured.
I am definitely not calling UserLimitConfigSet once for every interrupt that comes in, at least not for the user limit that triggered the interrupt. I tried connecting with WinDBG and putting a breakpoint in the RSI function RSIQVC!RSI::RapidCode::Impl::MotionController::UserLimitConfigSet as well as RSIQVC!RSI::RapidCode::Impl::MotionController::UserLimitEnableSet (just in case) and let things spin out of control. I also (temporarily) disabled calling it in the usual way (configuring the other user limit) just to see if some other thread/function was invoking it. The breakpoint never got hit even though my handler got hit a whole bunch of times.
Previously, my code was configuring a different user limit inside every invocation of a handler. However, I totally saw successive invocations of the same handler numerous times in a row before the other handler ever got invoked.
Would enabling a different user limit create a situation in which the current user limit would create another interrupt?
What I’m observing is that if I call the API function less often, the problem is less bad. However, I am certain that I’m not re-enabling the same user limit that resulted in this handler getting invoked, but the next time I wait for an interrupt, another user limit interrupt comes in for the same user limit (not the other one that I just configured).
Is it possible to call these functions too frequently or too close together?
Enabling a different user limit should not cause the current user limit to create another interrupt. Once again, we will try to reproduce the behavior and investigate.
We added a second user limit to our program, and in the handler for each, we enable the other user limit (by calling UserLimitConfigSet()). In the program output, we did not see consecutive interrupts from the same user limit. Can you think of anything else I can try in my code to reproduce the behavior you are seeing? When did your program stop working? Was this feature ever working or is this the first implementation you’ve tried?