[RMP 10.4.3] [INtime 6.4.21350.1]
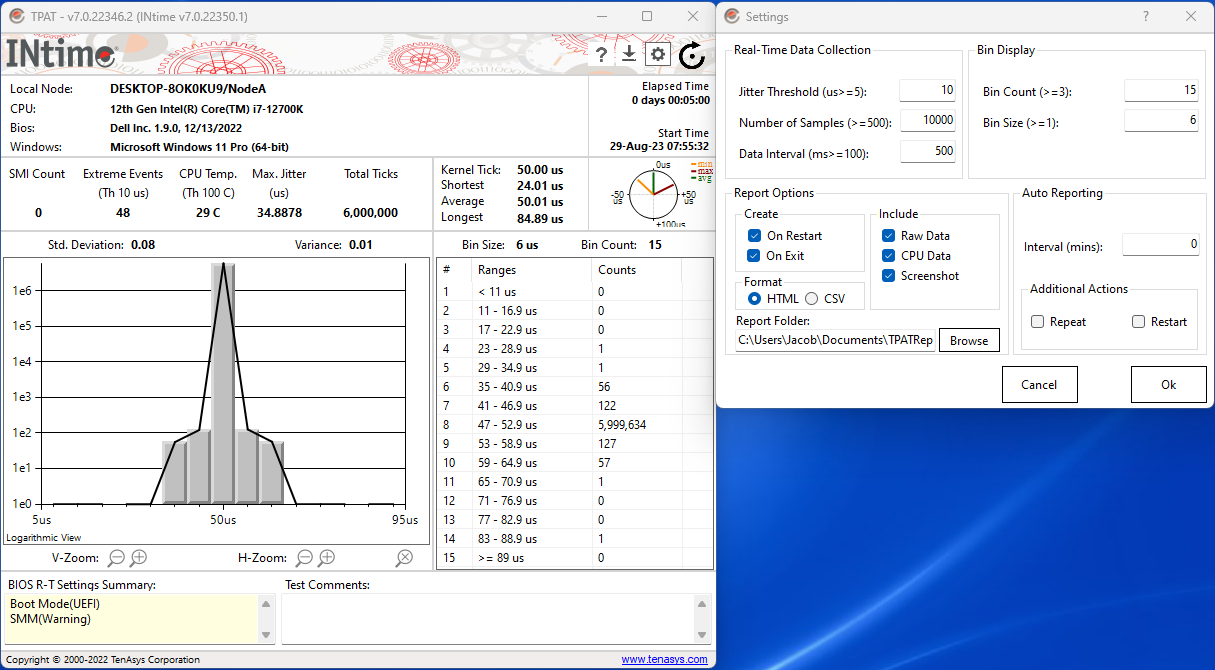
INtime ships with a cool tool, “Graphical Jitter Display” which maintains a histogram of tick times. We use this as a performance metric.
Is there a way to capture “raw” jitter data (for analysis)?
If I want to measure “how bad” something is, I can only increase the bucket sizes so that there’s nothing in the “<” and “>” buckets, but then I lose the shape of the distribution curve for the bulk of the points. If I could get access to the actual values and do something with them, I imagine that would afford me more options for analysis.
It would also be useful if I could perform these jitter measurements programmatically.
Is there a way I can do something like this?